
Bitcoin (BTC/USD), Litecoin (LTC/USD), Ethereum (ETH/USD), Technical Analysis – Talking Points
- Cryptocurrencies appear to be showing signs of fading momentum
- Bitcoin idling under all-time highs with SMAs supporting uptrend
- Litecoin, Ethereum consolidating as volatility makes large swings
Bitcoin has been consolidating against the US Dollar just under all-time highs, with other cryptocurrencies such as Litecoin and Ethereum, exhibiting similar trading dynamics. Recent price action shows that upside momentum has been fading, could a turn lower be in store ahead? Do keep in mind that cryptocurrencies can be quite volatile, and investors ought to take this into account around in developing their unique trading styles. To find out which style may fit your personality, check out our DNA quiz here.
Bitcoin Technical Outlook
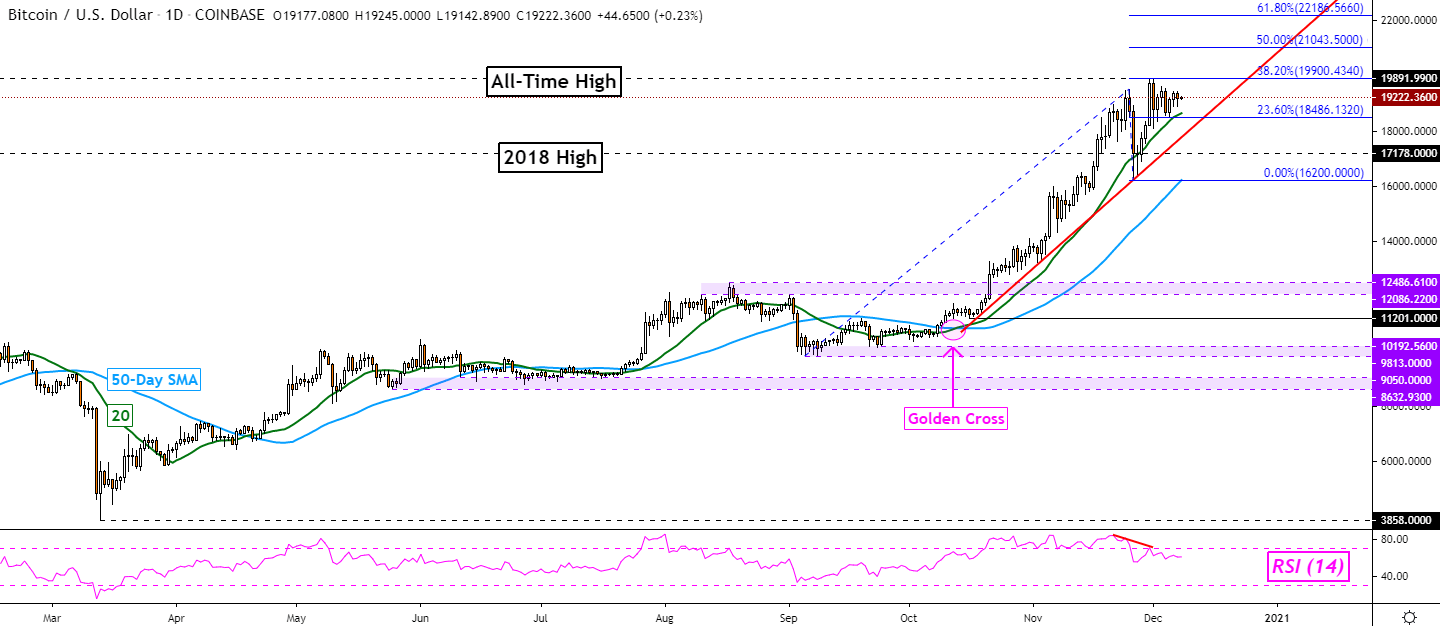
Following brief losses amounting to about 17% in late November, Bitcoin (BTC/USD) has pushed higher and is idling under all-time highs set in 2017 before the cryptocurrency bubble burst. The latter preceded about an 85% drop in Bitcoin before prices bottomed out in late 2018. Recent consolidation occurred as negative RSI divergence unfolded, a sign of fading upside momentum. At times, this can precede a turn lower.
Keep a close eye on the near-term 20-day Simple Moving Average (SMA) which is maintaining the focus to the upside. Beyond that sits a trendline from October and the medium-term 50-day SMA. Given the volatile nature of Bitcoin and cryptocurrencies, prices could bounce off the latter in the event of a turn lower. Otherwise, taking out the 50-day SMA exposes the 12086 – 12486 former resistance zone.

Recommended by Daniel Dubrovsky
Get Your Free Introduction To Bitcoin Trading
BTC/USD – Daily Chart
Litecoin Technical Outlook
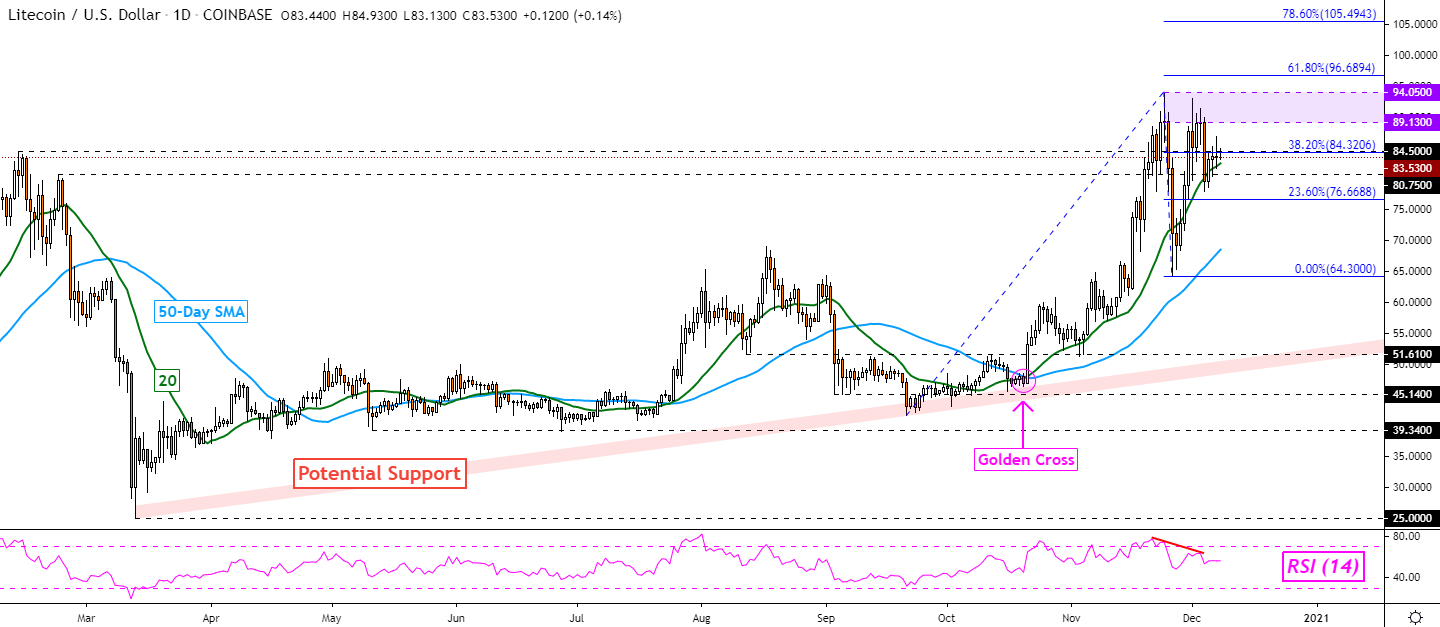
When looking at Litecoin, a cryptocurrency that has a much smaller market capitalization compared to Bitcoin, the volatility experienced in late November was more profound. LTC/USD dropped over 30% before bouncing just above the 50-day SMA. Prices seemed to have formed an area of resistance between 94.05 and 89.13 as Litecoin struggled to push above highs from earlier this year.
The turn lower on Friday occurred amid negative RSI divergence as well. Now, prices are hovering above the 20-day SMA which continues to keep the focus to the upside. Otherwise, a drop from here exposes the 50-day SMA which is now above the November 26th low. In the event of a profound shift lower, ‘potential support’ on the daily chart below could tame losses.
| Change in | Longs | Shorts | OI |
| Daily | -4% | -4% | -4% |
| Weekly | 4% | 4% | 4% |
LTC/USD – Daily Chart
Ethereum Technical Outlook
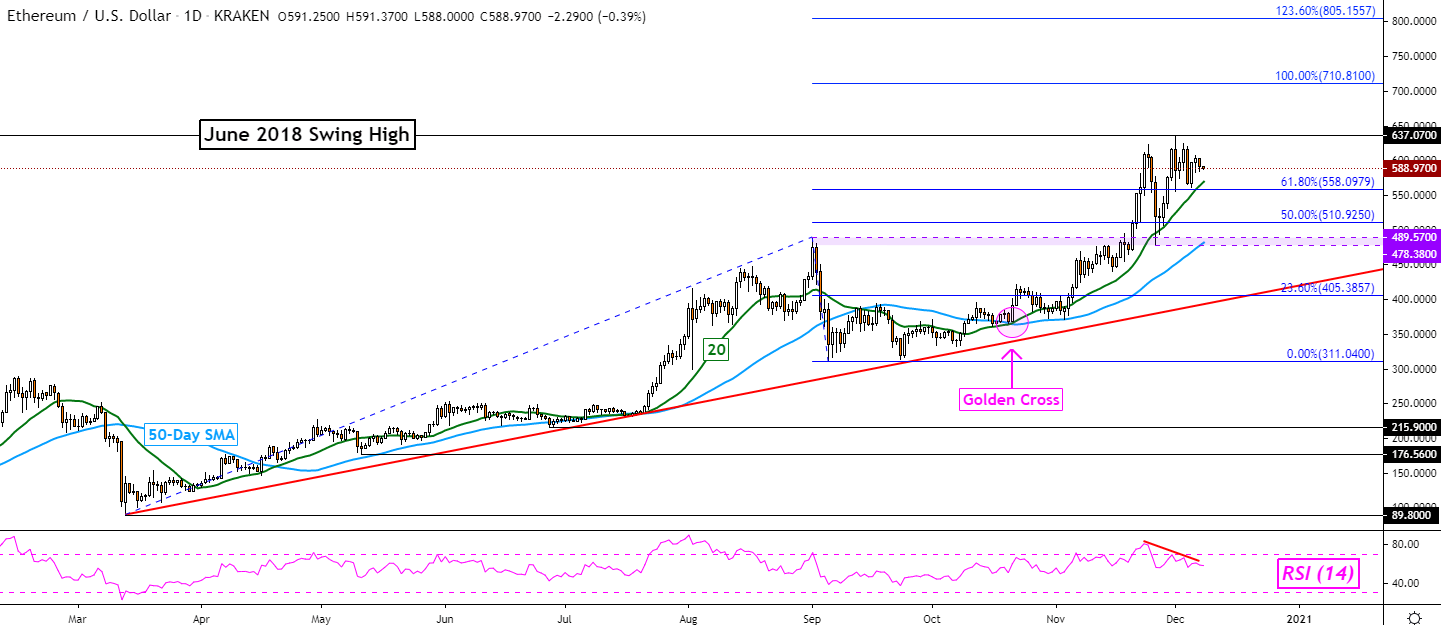
Ethereum is consolidating just under the June 2018 swing high in the aftermath of taking out the former 478 – 489 resistance zone. Immediate support appears to be the 61.8% Fibonacci extension at 558.09, just under the 20-day SMA. Negative RSI divergence is also present here, signaling that traders ought to be mindful of the possibility for a pullback.
In the event of a turn lower, a drop may pause on the 50-day SMA as it keeps the trend tilted towards the upside. But more broadly speaking, rising support from March could also come into play for maintaining the dominant uptrend. Otherwise, a push above 637.07 exposes the 100% extension at 710.81 on the way towards the 123.60% level at 805.15.
ETH/USD – Daily Chart
— Written by Daniel Dubrovsky, Currency Analyst for DailyFX.com
To contact Daniel, use the comments section below or @ddubrovskyFX on Twitter