
- After days in the positive region, Xrp prepares to drop by 19% before a bounce back.
- The Fibonacci retracement tool confirms the sell signal on a daily chart.
It would seem that the price of XRP is showing signs of a potential retracement before bouncing off to the upside in the short term. Indicators show that incoming bearish momentum could see it go as low as $0.27 before it takes off.
XRP at the brink of retracement before next leg up
On the daily chart, a reversal in the price of XRP seems to be brewing as the TD sequential indicator presents a sell signal. If the price sustains the rally above $0.31, the bearish stance will be invalidated, going as high as $0.33 or $0.35.
XRP/USD Daily chart
Another indicator further reinforces this bearish outlook. A movement to the downside is expected as we see XRP falling to the 61.8% or 50% on the Fibonacci retracement levels before advancing further. Meaning prices could drop to $0.27 or $0.26.
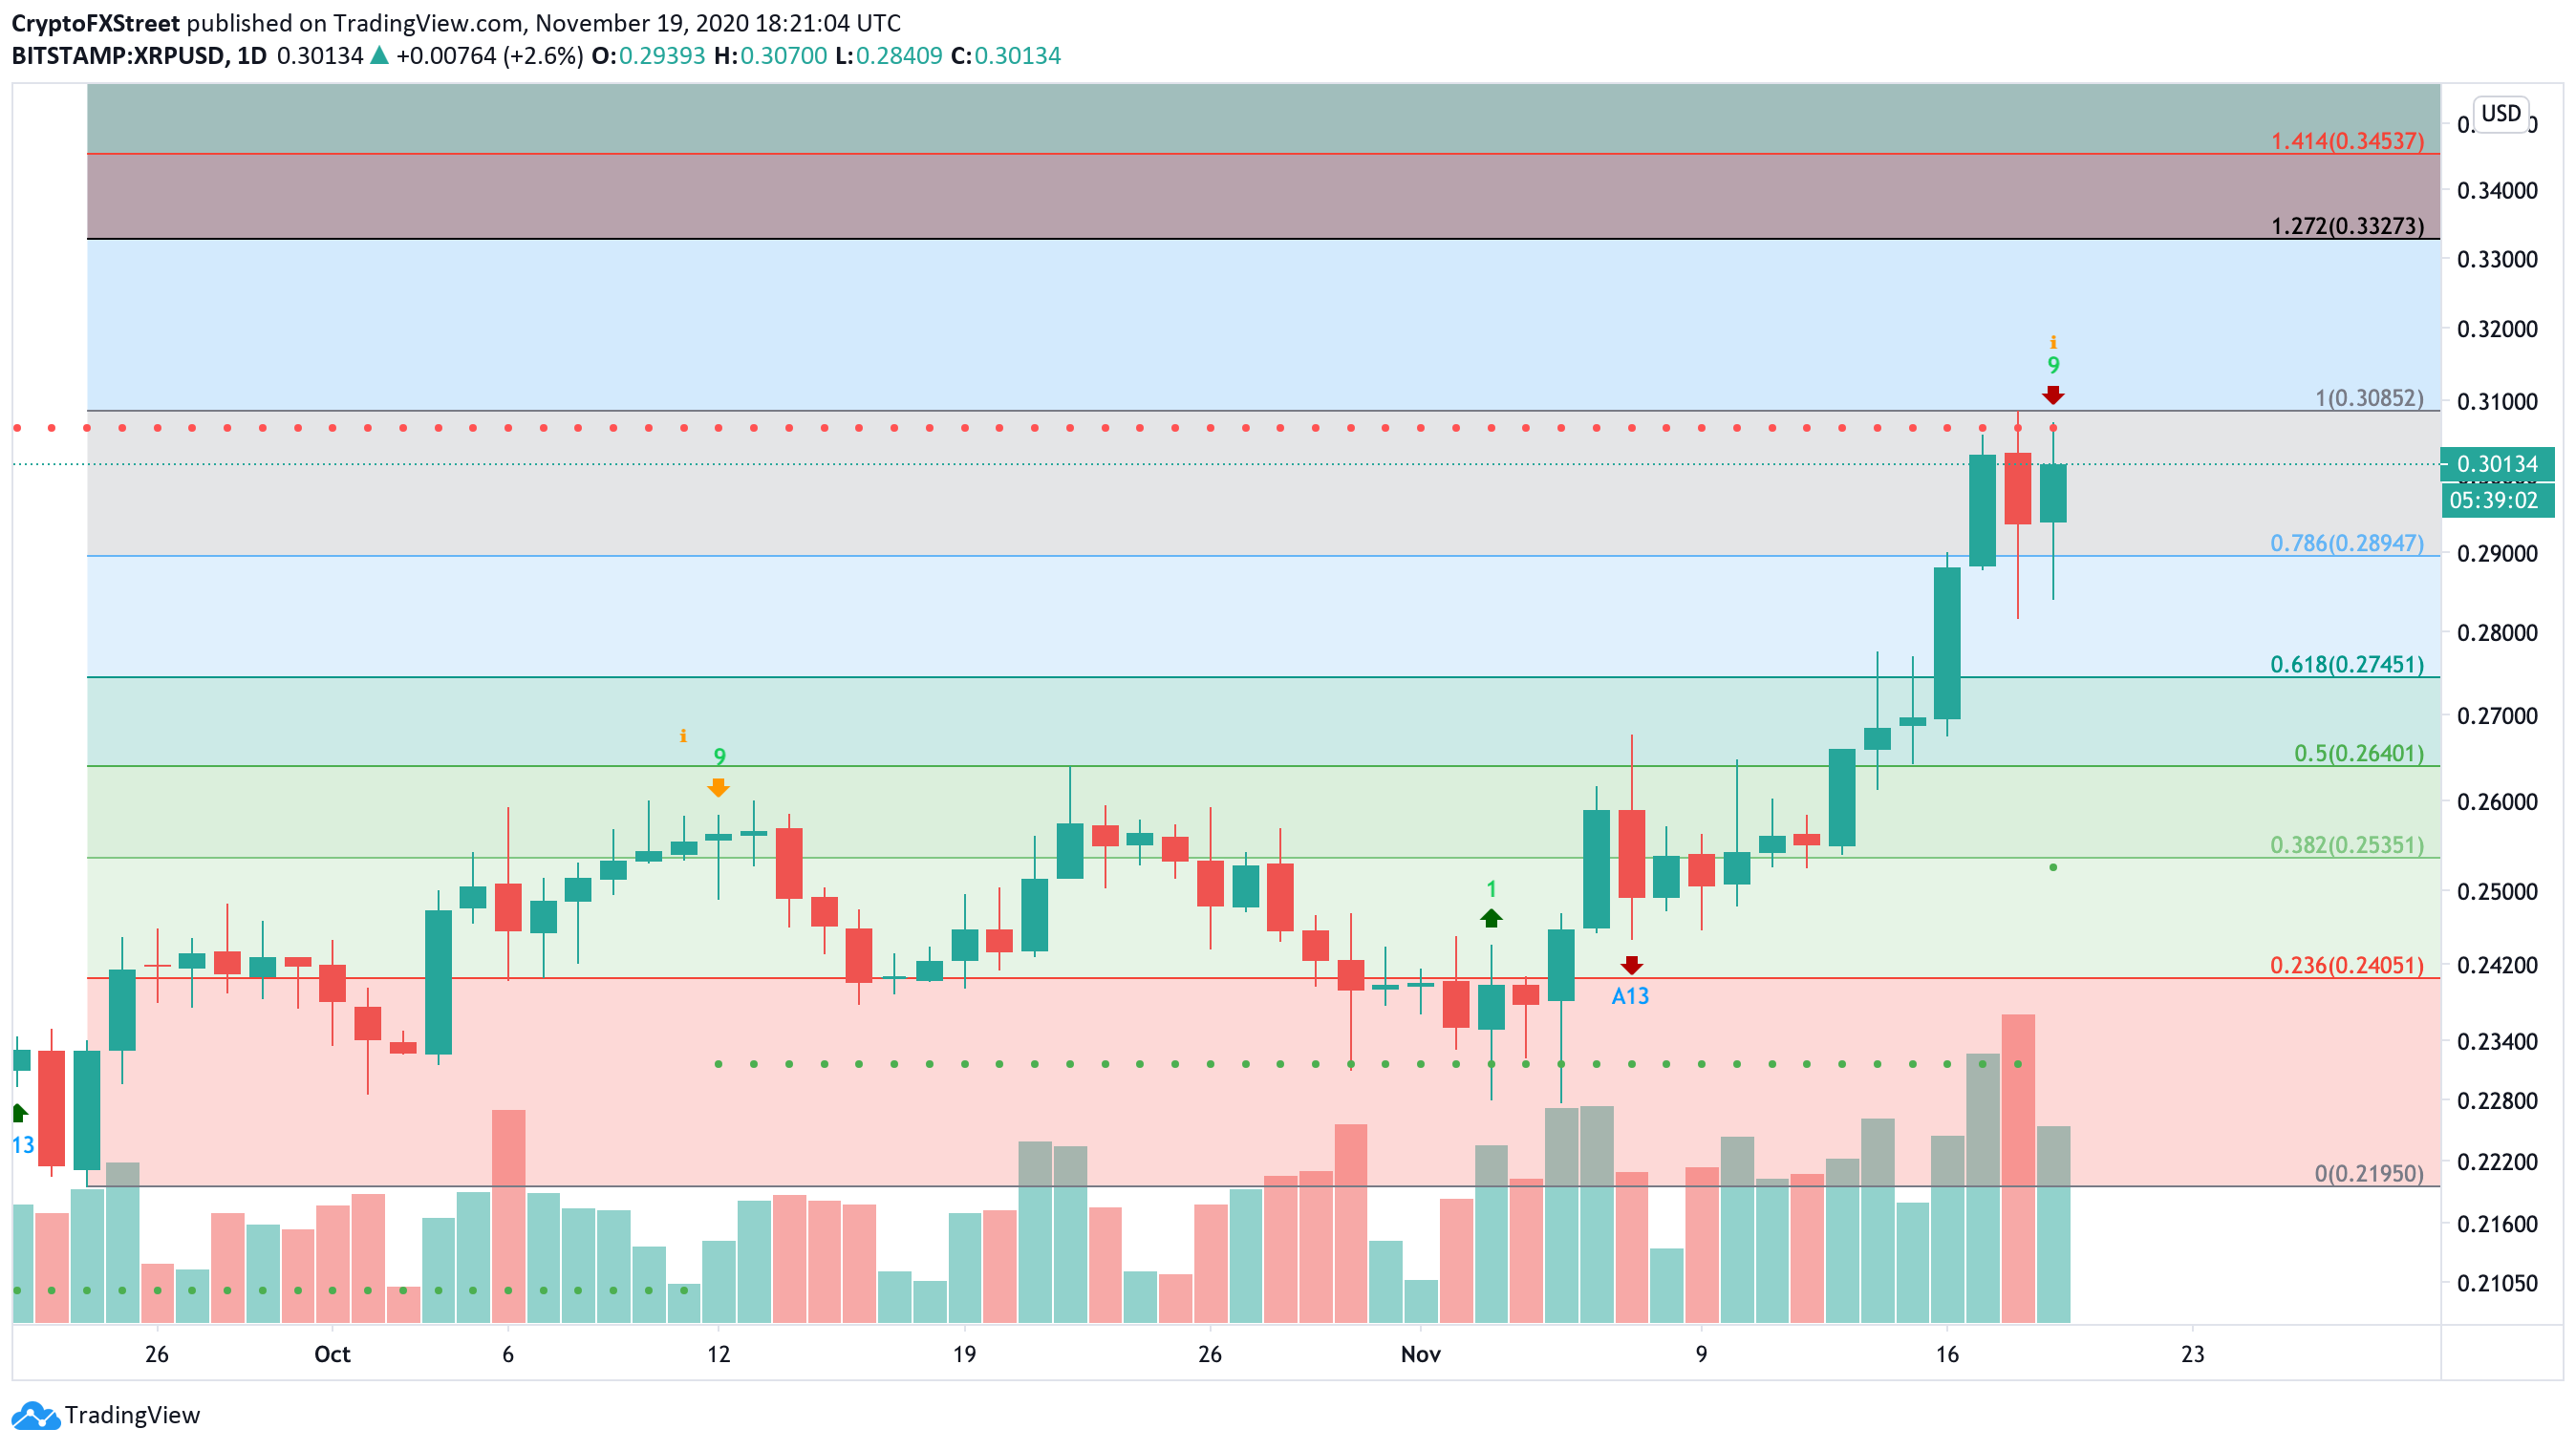
XRP/USD Daily chart
On the other hand, if the market maintains some consolidation, a decent increase in buy pressure could turn things around, returning the price above the $0.31 zone.