- Ethereum is about to reach the price target as determined by ascending triangle formation.
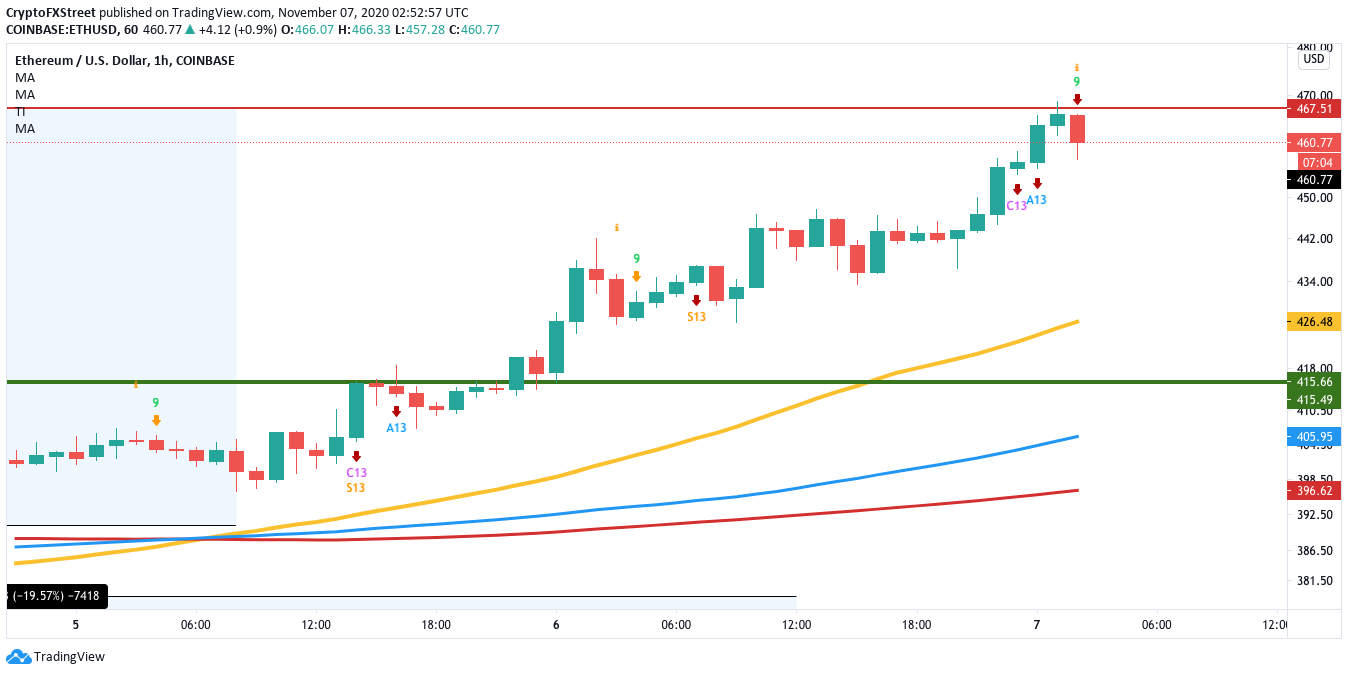
- The one-hour chart has flashed the sell signal in the TD sequential indicator.
The number 2 cryptocurrency in the world slipped sharply from $475 to $320.25 between September 2 and September 23. Since then, the buyers could wrest back control and push the price up in an ascending triangle formation. As previously reported by FXStreet, the price goal for ETH, as determined by the triangle, is around $475. The buyers are currently on the verge of breaking past this level.
Ethereum to go for $500 soon
The bulls have been in complete control of the market for the last five days, wherein the smart contract platform jumped from $380 to $460. The price has already faced rejection at the $475 resistance barrier. If the buyers manage to overcome this, they should be able to reach $500.
ETH/USD 1-day chart
IntoTheBlock’s In/Out of the Money Around Price (IOMAP) visualizes strong resistance and support walls. As per the IOMAP, the resistance levels upfront aren’t that strong. As such, a break above the $475 barrier should take ETH up to $500.
ETH IOMAP
However, it’s not all sunshine and roses for the buyers. The 1-hour chart for ETH/USD has flashed the sell signal via the TD sequential indicator’s green-nine candlestick. This should prompt a short-term retracement before the price picks up steam and breaches $500.
ETH/USD 1-hour chart
The IOMAP shows that there are two support walls at $420 and $400. These two walls should be strong enough to absorb a tremendous amount of selling pressure. If the bears somehow manage to break below these levels, the next viable support lies at the 200-day SMA ($300).


