
- XRP has been trading inside an ascending triangle pattern on the daily chart for several weeks.
- Bulls have defended the lower trendline of the pattern and are targeting a breakout above $0.26.
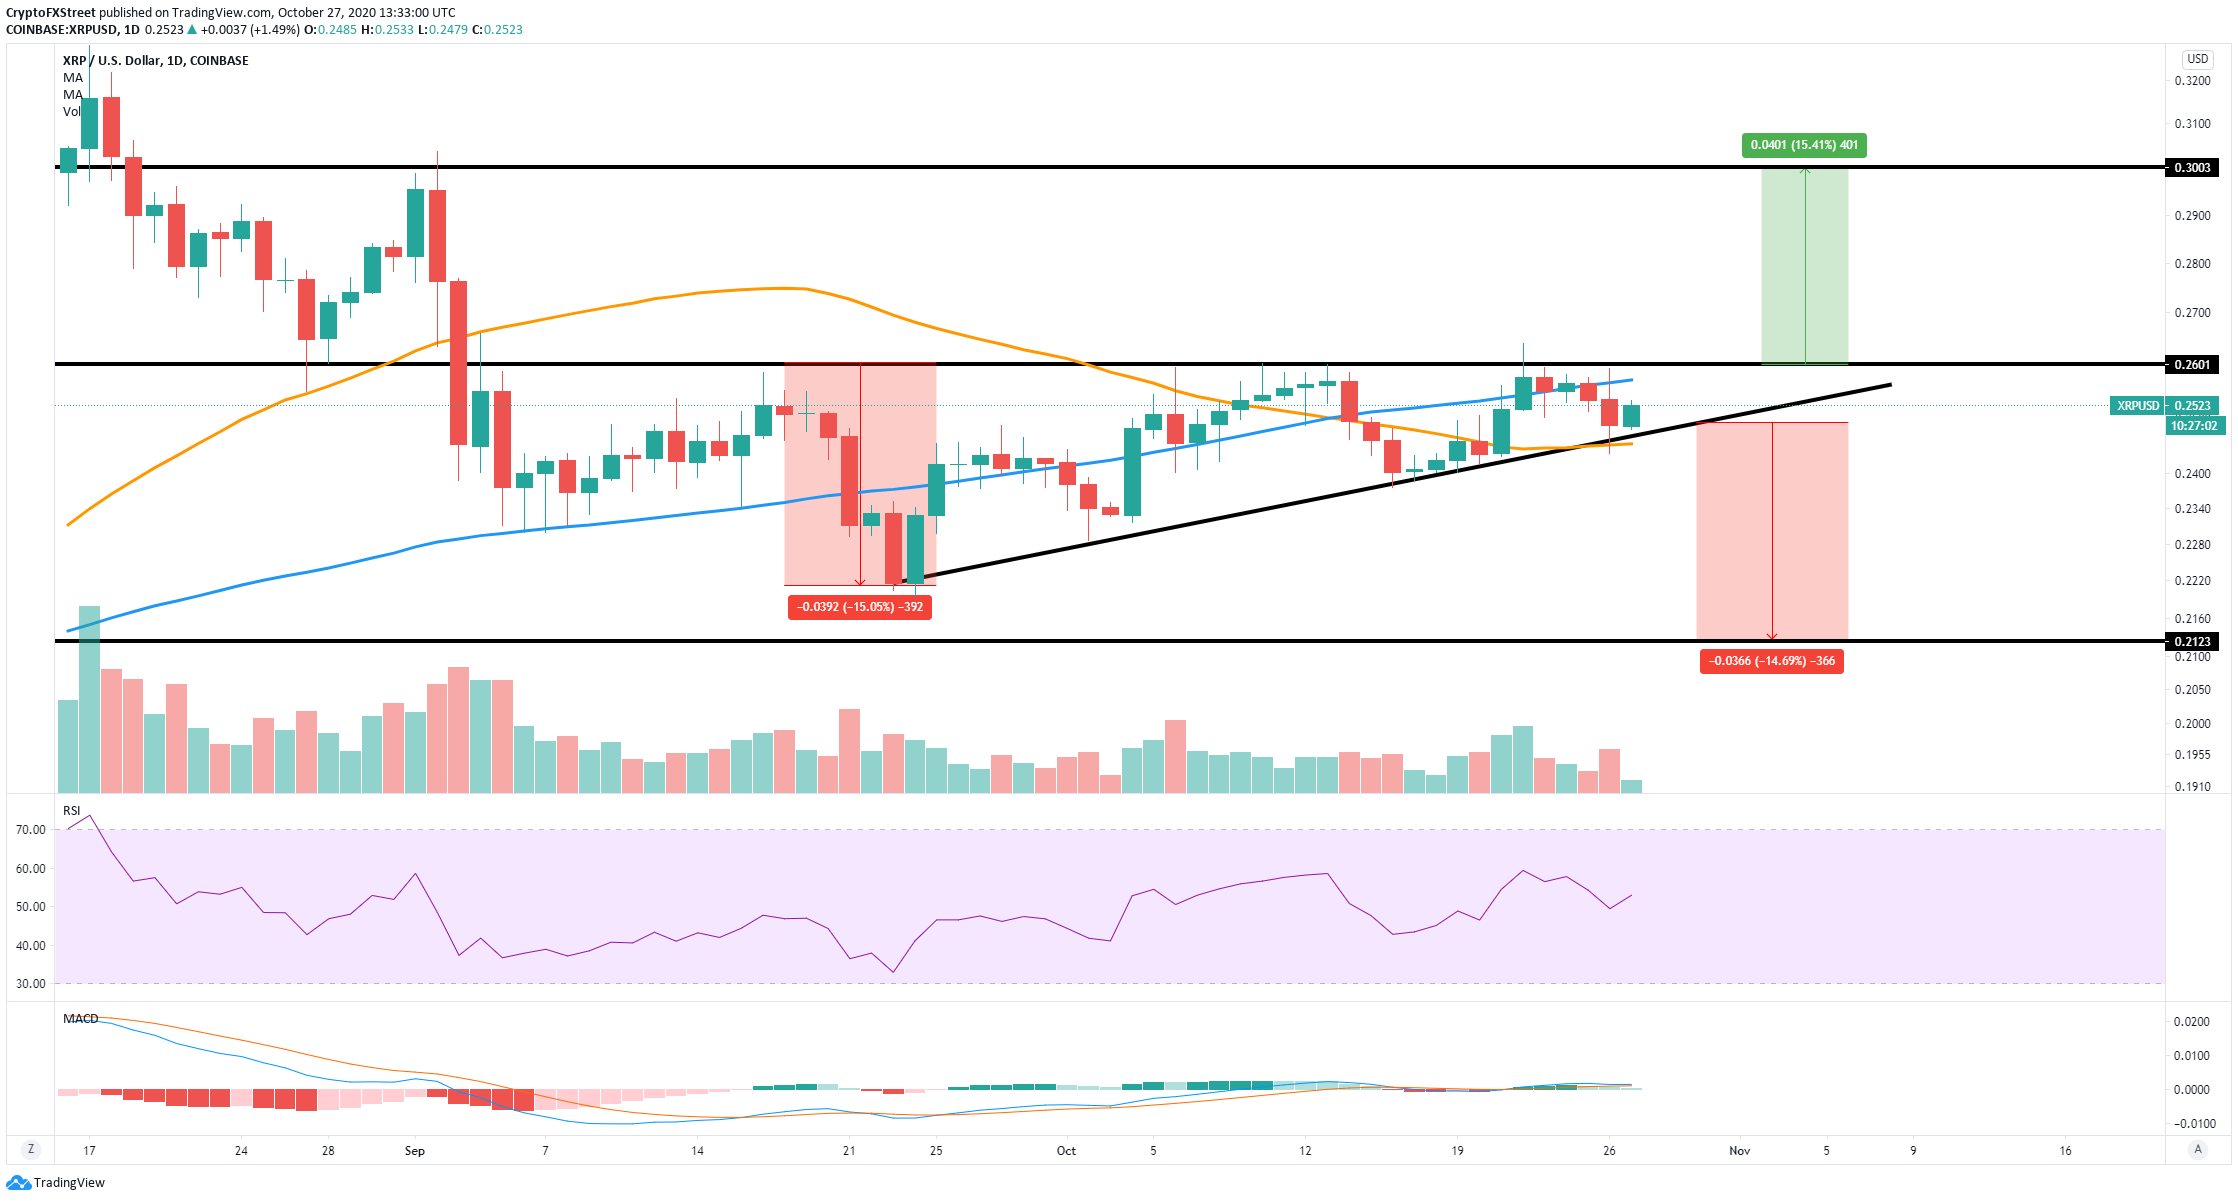
XRP is currently trading at $0.252 after successfully defending a critical support level at $0.247. In the past two weeks, the digital asset has been rejected from the upper boundary of the daily ascending triangle around ten times.
XRP needs to break the $0.26 resistance level to reach $0.30
Bulls have defended the support level at $0.247, which coincides with the 50-SMA. The daily MACD remains bullish and will gain some momentum after the rebound in the past 24 hours. The critical resistance level is still located at $0.26.
XRP/USD daily chart
The resistance at $0.26 also coincides with the 100-SMA. A daily candlestick close above this point can drive the price of XRP up to $0.30. However, bulls need to ensure that XRP will not experience another fakeout as the one seen on October 22.
Can bears hold this short-term resistance level?
On the 4-hour chart, the rebound seems to have been stopped by the 50-SMA at $0.252, acting as a strong resistance level. Additionally, the MACD turned bearish on October 23 and has remained that way ever since.
XRP/USD 4-hour chart
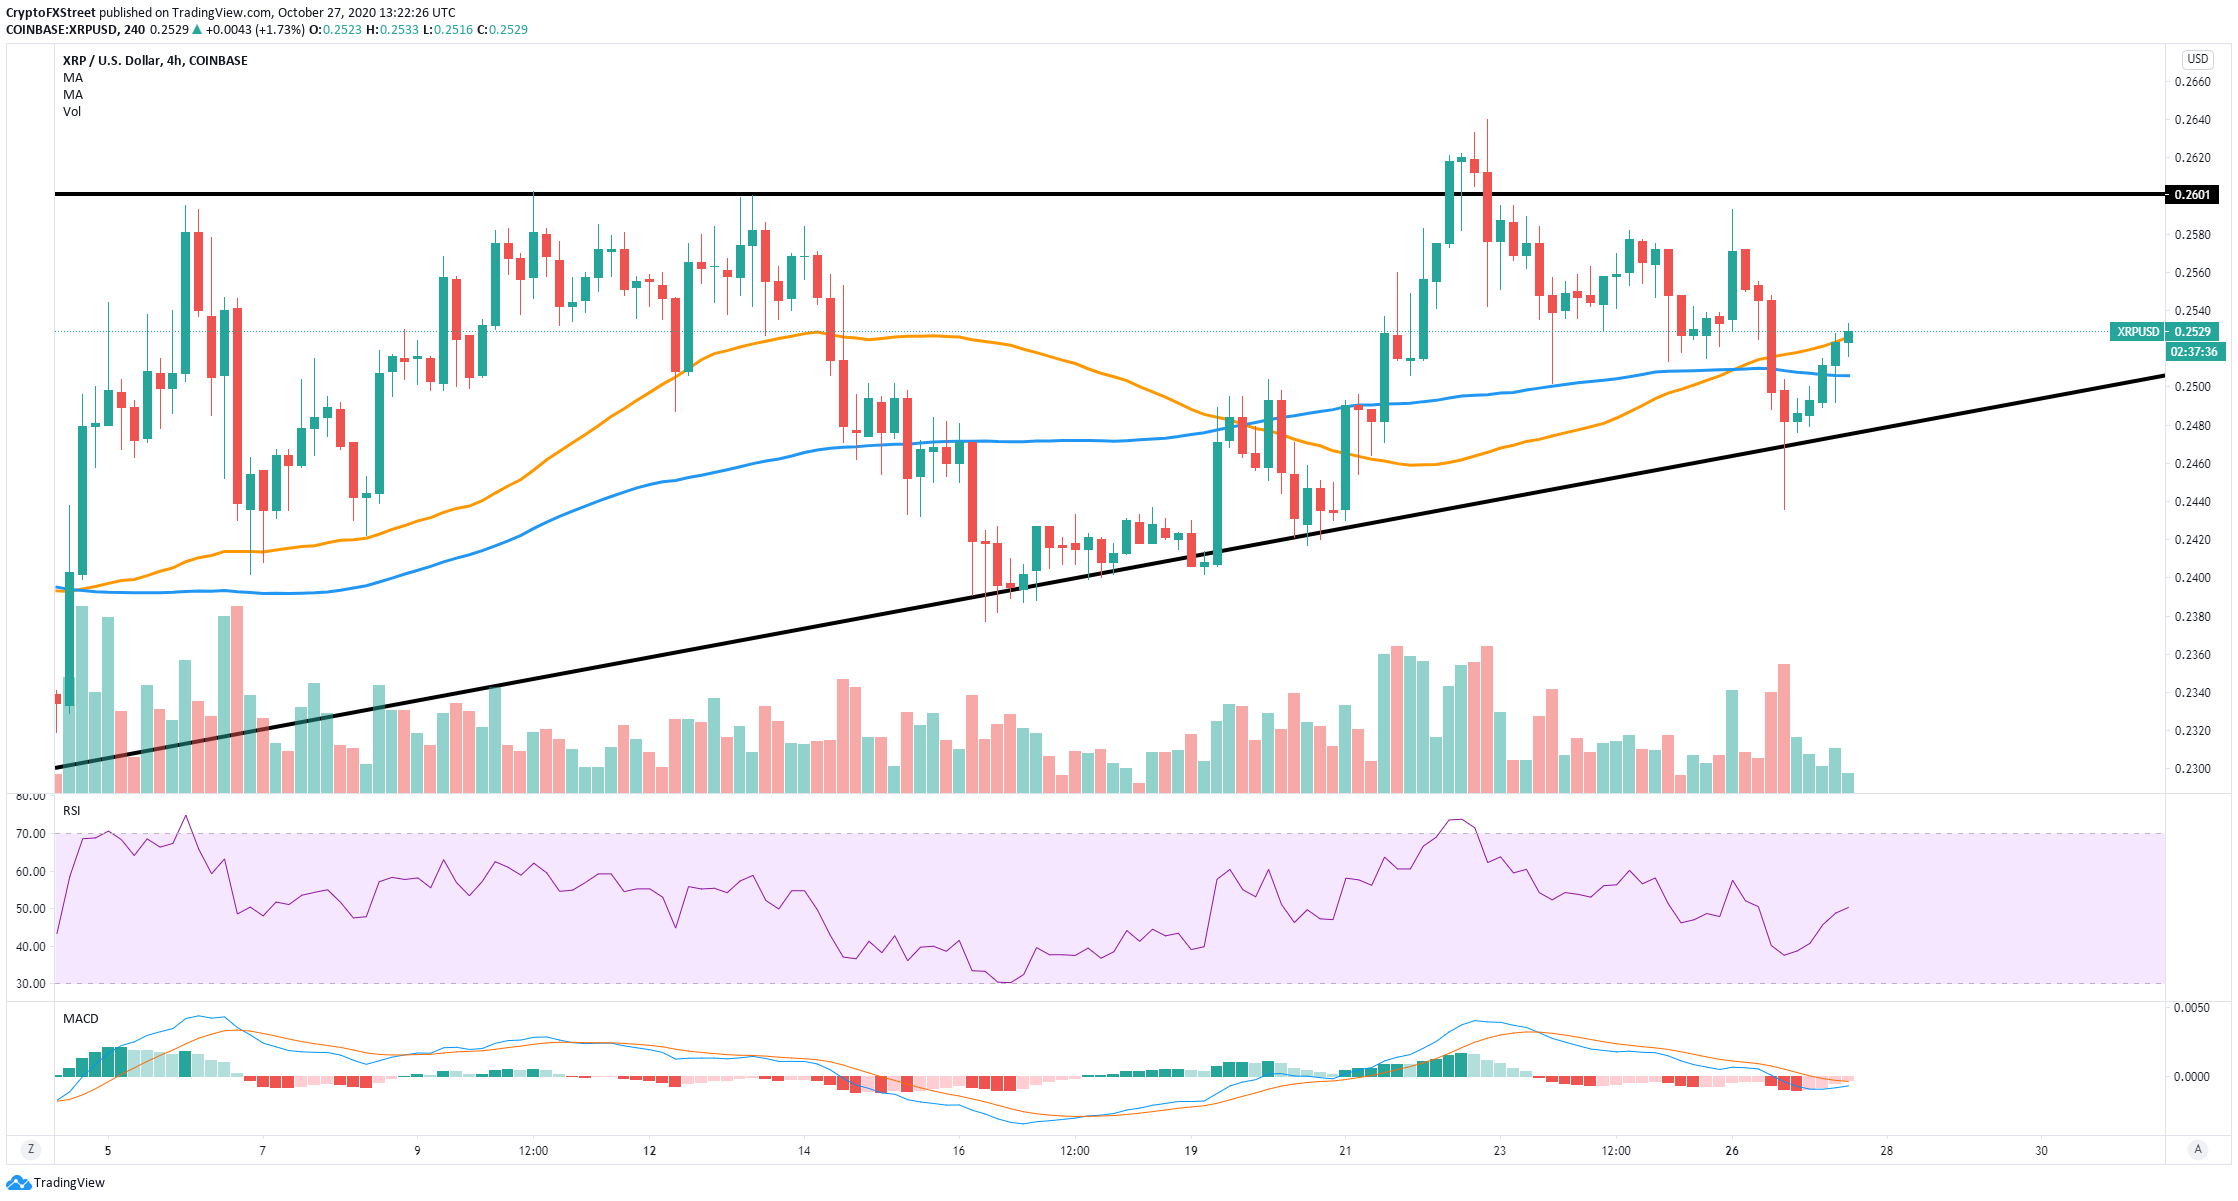
Rejection from the 50-SMA at $0.252 can push XRP down to the ascending triangle’s hypotenuse at $0.247. Moving past this critical support level can lead to a steep correction towards $0.213.