
ETH/USD – Bulls Retest Bearish .618 Fib Resistance
Key Support Levels: $410, $400, $387.
Key Resistance Levels: $416, $421, $439.
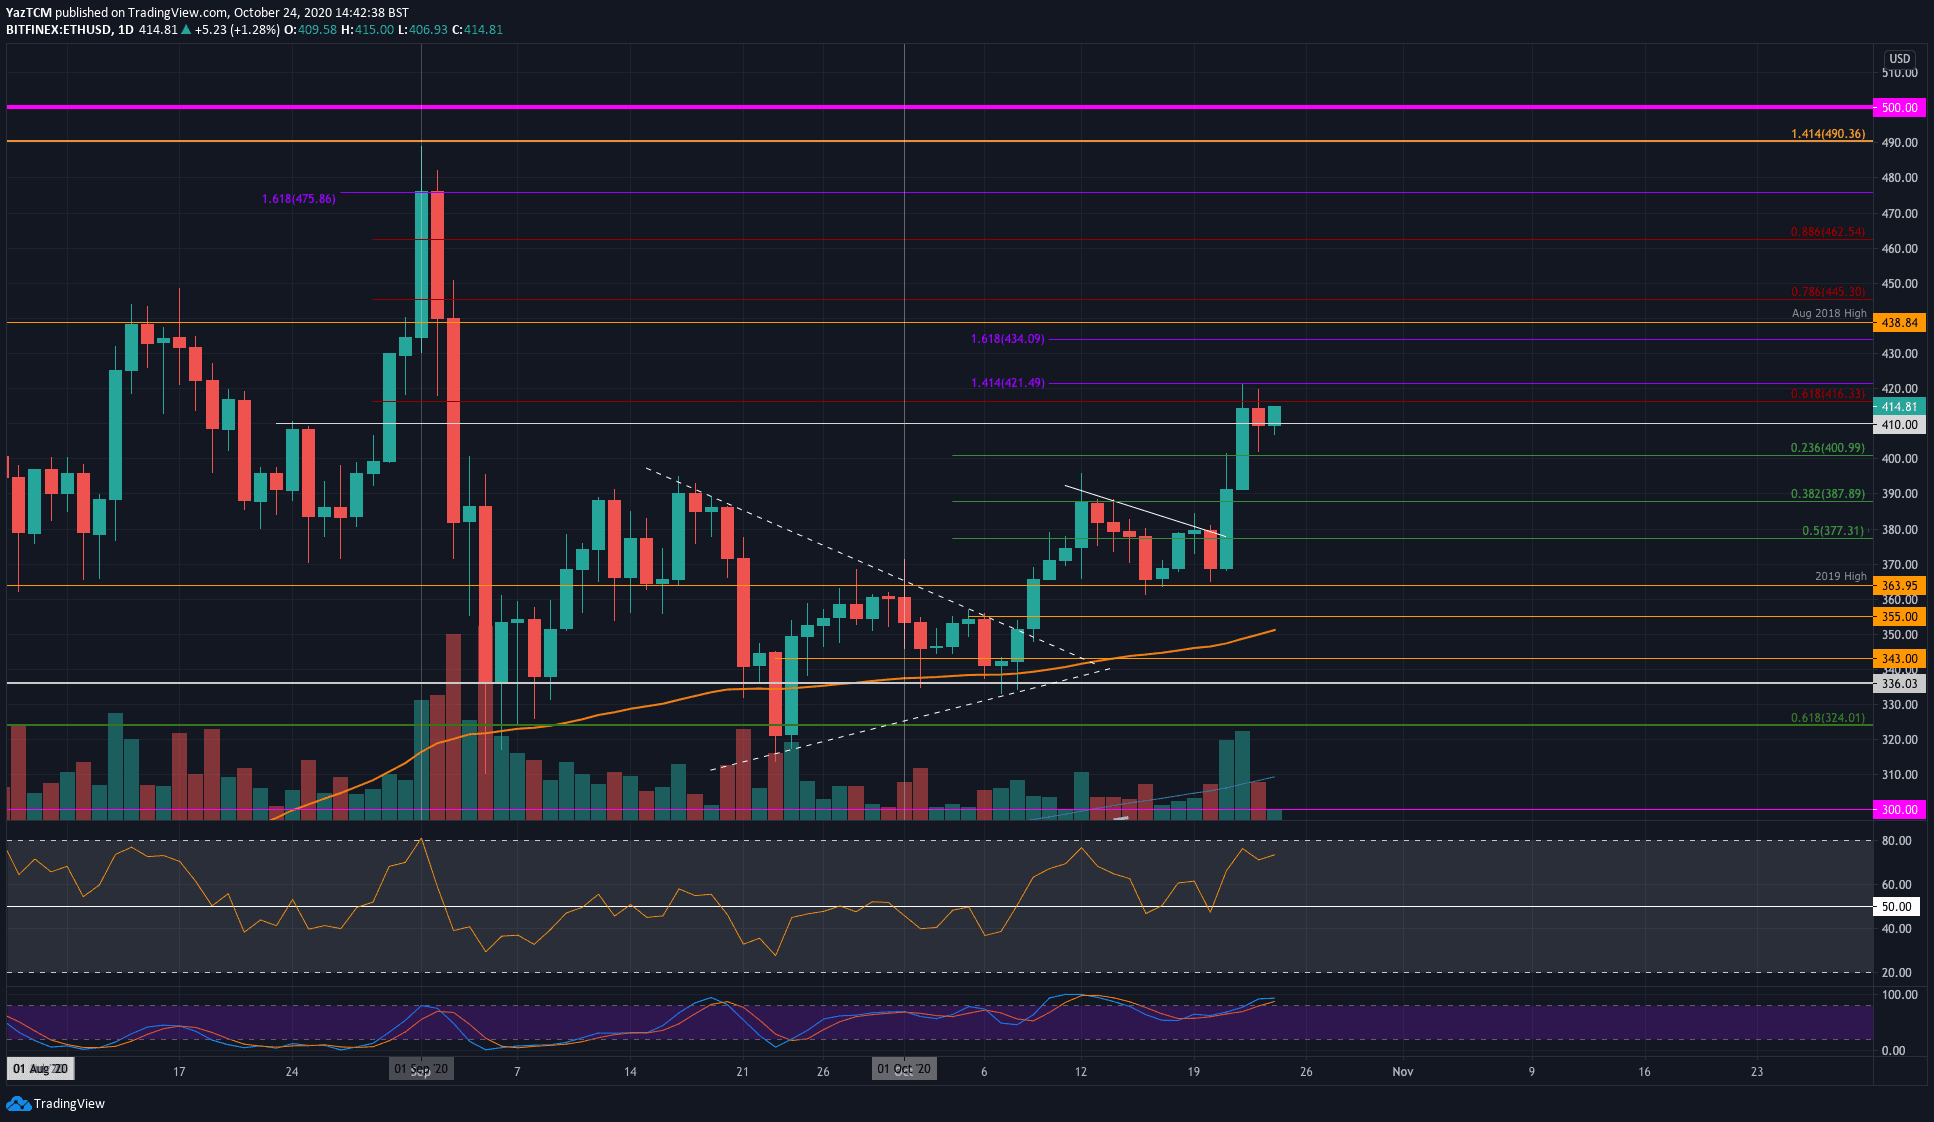
Ethereum saw a strong 13% price surge this past week as it reached as high as $421 (1.414 Fib Extension). More specifically, the buyers could not close a daily candle above the resistance at the bearish .618 Fib Retracement at $416.
After heading back into $400 yesterday, the bulls have rebounded and are now retesting the aforementioned level.
ETH-USD Short Term Price Prediction
Looking ahead, once the buyers break $416, the first level of resistance lies at $421.50 (1.414 Fib Extension). This is followed by resistance at $434, $439 (August 2018 Highs), and $445 (bearish .786 Fib). $450, added resistance lies at $462 and $475.
On the other side, the first level of support lies at $410. Beneath this, support is found at $400, $387 (.382 Fib), and $377 (.5 Fib).
The RSI is approaching overbought conditions but still has room to push higher before becoming truly overbought.
ETH/BTC – Bulls Testing 100-days EMA Resistance
Key Support Levels: 0.0311 BTC, 0.0305 BTC, 0.03 BTC.
Key Resistance Levels: 0.0327 BTC, 0.0337 BTC, 0.0341 BTC.
Against Bitcoin, Ethereum struggled this week as it dropped as low as 0.0305 BTC. It has since bounced higher to climb back above 0.031 BTC to trade at the current 0.0318 BTC level. It is now testing resistance at a 100-days EMA and must overcome this to head back toward the October highs at 0.0337 BTC.

ETH-BTC Short Term Price Prediction
Looking ahead, if the bulls can break the 100-days EMA, the first level of resistance lies at 0.0327 BTC (bearish .236 Fib Retracement). This is followed by resistance at 0.0337 BTC (March 2019 Support – now resistance), 0.0341 BTC (bearish .382 Fib), and 0.035 BTC.
On the other side, the first level of support lies at 0.0311 BTC (.618 Fib). Beneath this, support lies at 0.0305 BTC, 0.03 BTC, and 0.0295 BTC (200-days EMA).
The Stochastic RSI recently rebounded, which put an end to the downward pressure. For a bullish recovery above the 100-days EMA, the RSI must pass the mid-line to indicate bullish momentum within the market.
Binance Futures 50 USDT FREE Voucher: Use this link to register & get 10% off fees and 50 USDT when trading 500 USDT (limited offer).
Disclaimer: Information found on CryptoPotato is those of writers quoted. It does not represent the opinions of CryptoPotato on whether to buy, sell, or hold any investments. You are advised to conduct your own research before making any investment decisions. Use provided information at your own risk. See Disclaimer for more information.
Cryptocurrency charts by TradingView.