
- Bitcoin holds above $12,800 following rejection at $13,200; a reversal seems imminent.
- Ethereum brushes shoulders with $420 for the first time since early September but fails to sustain the uptrend.
- Ripple is ready for a retreat to $0.25; from here, buyers will strategize the liftoff to $0.3.
The cryptocurrency market performed tremendously well this week, especially for the major cryptoassets like Bitcoin and Ethereum. Several altcoins also broke out, including Chainlink, VeChain, Stellar, Litecoin and Waves.
The massive bullish action was reflected by the significant increase in the total market capitalization. A monthly high of $400 billion was achieved on Thursday. The 24-hour volume has also been on an upward roll, hitting levels above $100 billion.
Bitcoin takes a breather ahead of massive price action
Bitcoin soared to new yearly highs, as reported on October 22. However, a reversal took place, sending the flagship cryptocurrency under $13,000. Immense support has kept the selling pressure in check while bulls eye the ultimate lift to $14,000.
The bullish outlook is likely to be validated by a break past $13,000. The 50 Simple Moving Average (SMA) on the hourly is the initial and critical support. Other key areas to keep in mind include $12,200 and the 200 SMA marginally above $11,800.
BTC/USD 1-hour chart
IntoTheBlock’s IOMAP model reveals the absence of a substantial resistance heading to $14,000. This gives credence to the bullish narrative and potential bull run to Bitcoin’s all-time high as long as the immediate hurdle between $12,977 and $13,363 is broken. Here, around 102,000 addresses previously bought approximately 65,000 BTC.
On the downside, increasing support is observed by the model. On the other hand, the robust buyer congestion zone running from $11,413 and $11,799 will absorb most of the selling pressure. Here roughly 1.8 million addresses previously bought around 1.1 million BTC.
Bitcoin IOMAP chart
-637390383120203352.png)
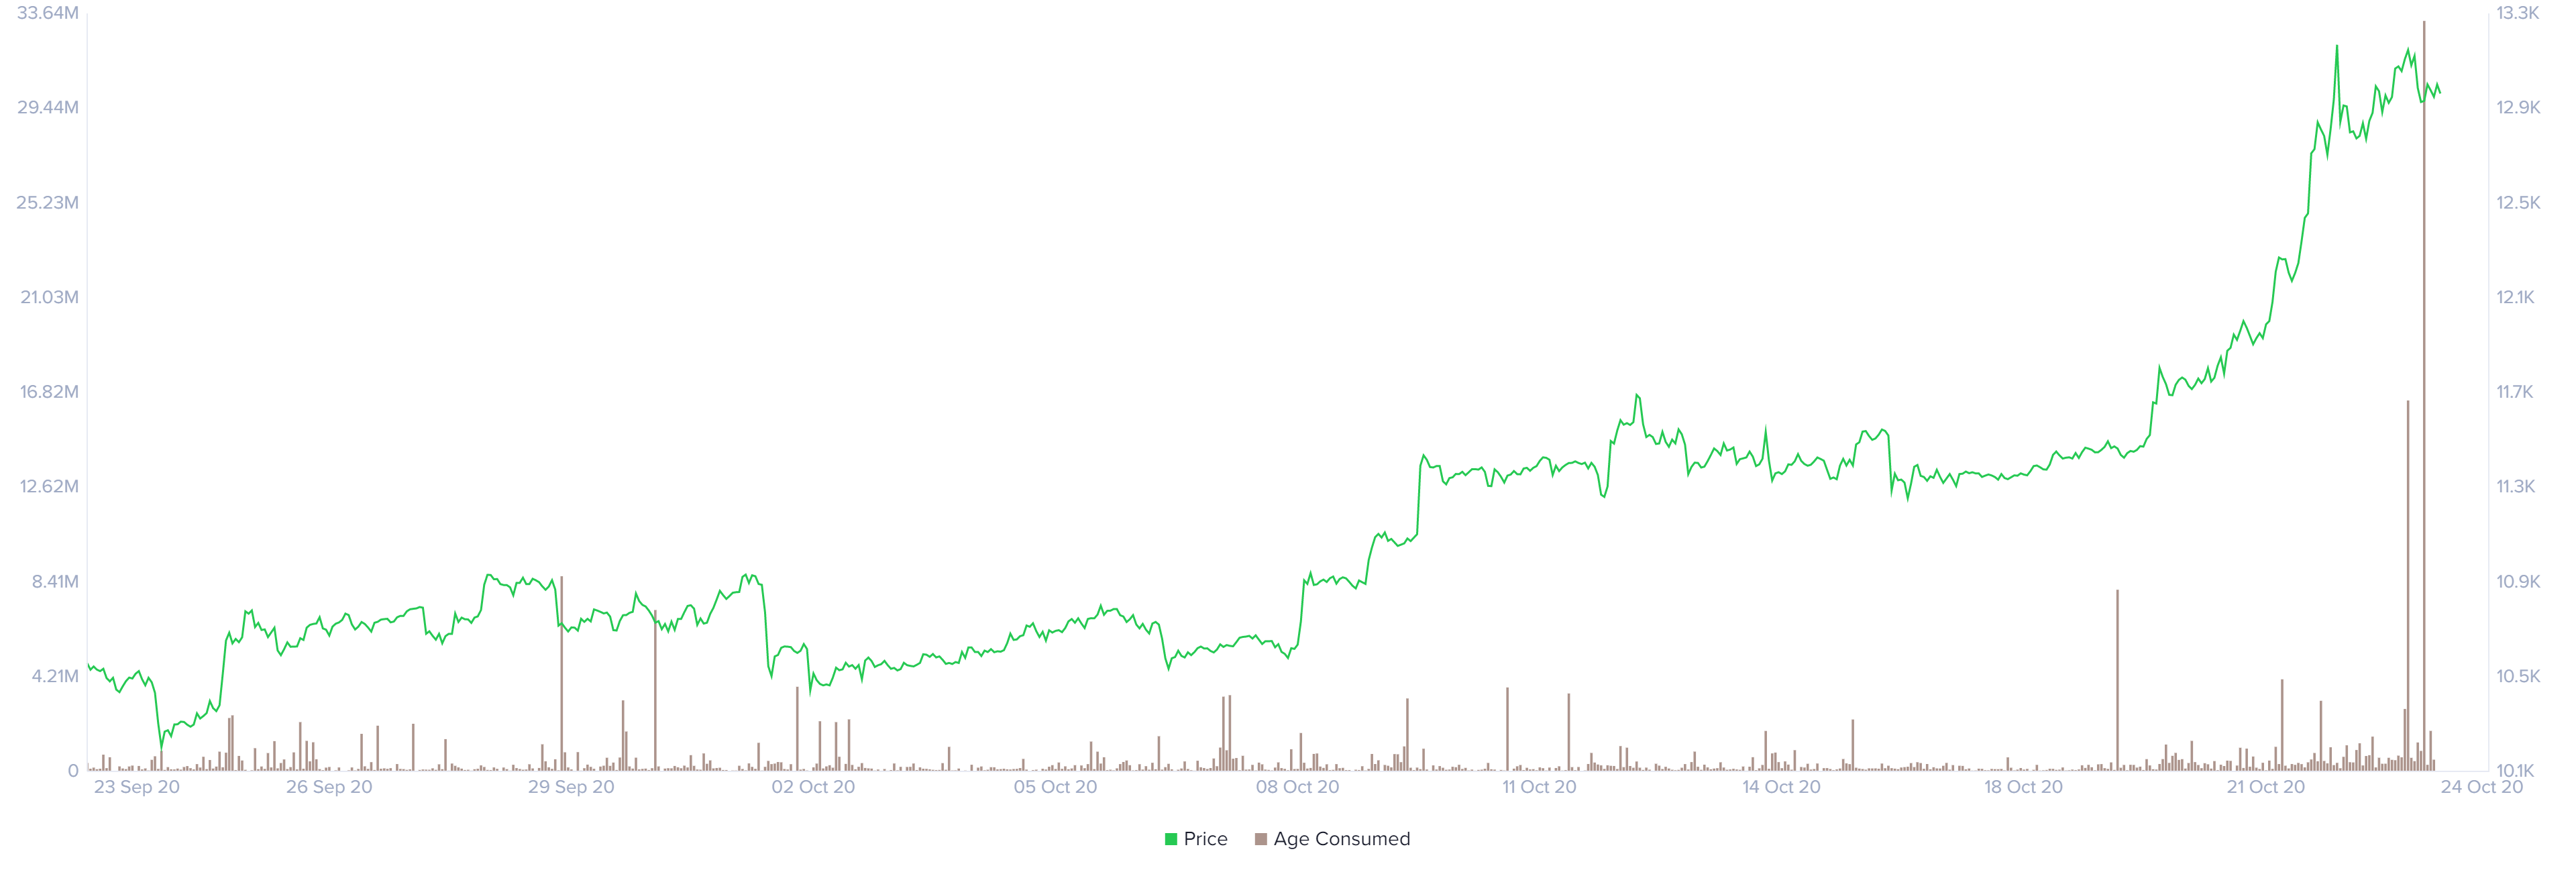
According to Santiment, Bitcoin saw a spike in age consumed on Friday. Age consumed is a metric that measures the number of tokens moved relative to the time they have stayed idle. A spike in this on-chain metric usually results in high volatility as well as significant price action. Therefore, it is likely that BTC will make a significant move during the weekend session.
Bitcoin age consumed chart
Ethereum reversal in the offing
Ethereum paced above $400 and touched $420. However, buyers lost steam and were unable to support the bullish outlook. Instead, Ether is trading at $414 amid a growing bearish grip, as shown by the Relative Strength Index (RSI).
The smart contract token is also trading within a sharply ascending parallel channel. It is doubtful, the crypto will sustain the intense price action, and hence a reversal is likely to occur towards $400. In case of extended declines, support is envisaged at the 50 SMA, the 100 SMA and $360.
ETH/USD 2-hour chart
 - 2020-10-23T102423.996-637390384014516679.png)
A slump in the new addresses created on the network over the last few days is a bearish indicator. IntoTheBlock’s “Daily Active Addresses” metric highlights a significant drop from roughly 313,900 addresses created on October 18 to nearly 147,000 on October 22.
If the downtrend continues, it will be difficult for ETH to sustain the uptrend above $400. A downtrend in network growth negatively affects inflow and outflow of tokens as well as the platform’s liquidity; thus, traders be aware.
Ethereum new addresses chart
-637390384357461073.png)
According to Santiment’s holder distribution metric, Ethereum whales are currently offloading tokens, perhaps to take profit after the spike to $420. For instance, addresses holding between 100,000 and 1 million ETH dropped from 166 on October 14 to 163 on October 23.
The decrease may look minor, but the volume the whales move is colossal. Hence, selling pressure is bound to intensity, forcing ETH/USD into a correction. In other words, the bearish pressure is validated.
Ethereum holder distribution chart
 holder distri-637390384668899773.png)
Ripple on the verge dumping to $0.25
XRP bullish price action this week pierced the resistance at $0.26 but could not sustain the momentum to accomplish the rest of the journey to $0.3. An ongoing reversal eyes lower levels at $0.25, where the 100 SMA provides support in the 2-hour timeframe.
The RSI reinforces the bearish outlook as it slides to the midline from the overbought area. If push comes to shove and declines continue in the near term, the 200 SMA and the $0.24 level will work to absorb the selling pressure.
XRP/USD 4-hour chart
-637390385296355144.png)
Santiment on-chain data add credence to the bearish outlook following an upswing in both volume and social media mentions. Initially, a gradual increase in these two parameters highlights a potential rally. However, once at the peak, they signal a possible price reversal. In this case, spikes point towards increasing bearish pressure.
Ripple social media mentions/volume chart
 [11.29.32, 23 Oct, 2020]-637390385826549726.png)
Daily takeaway
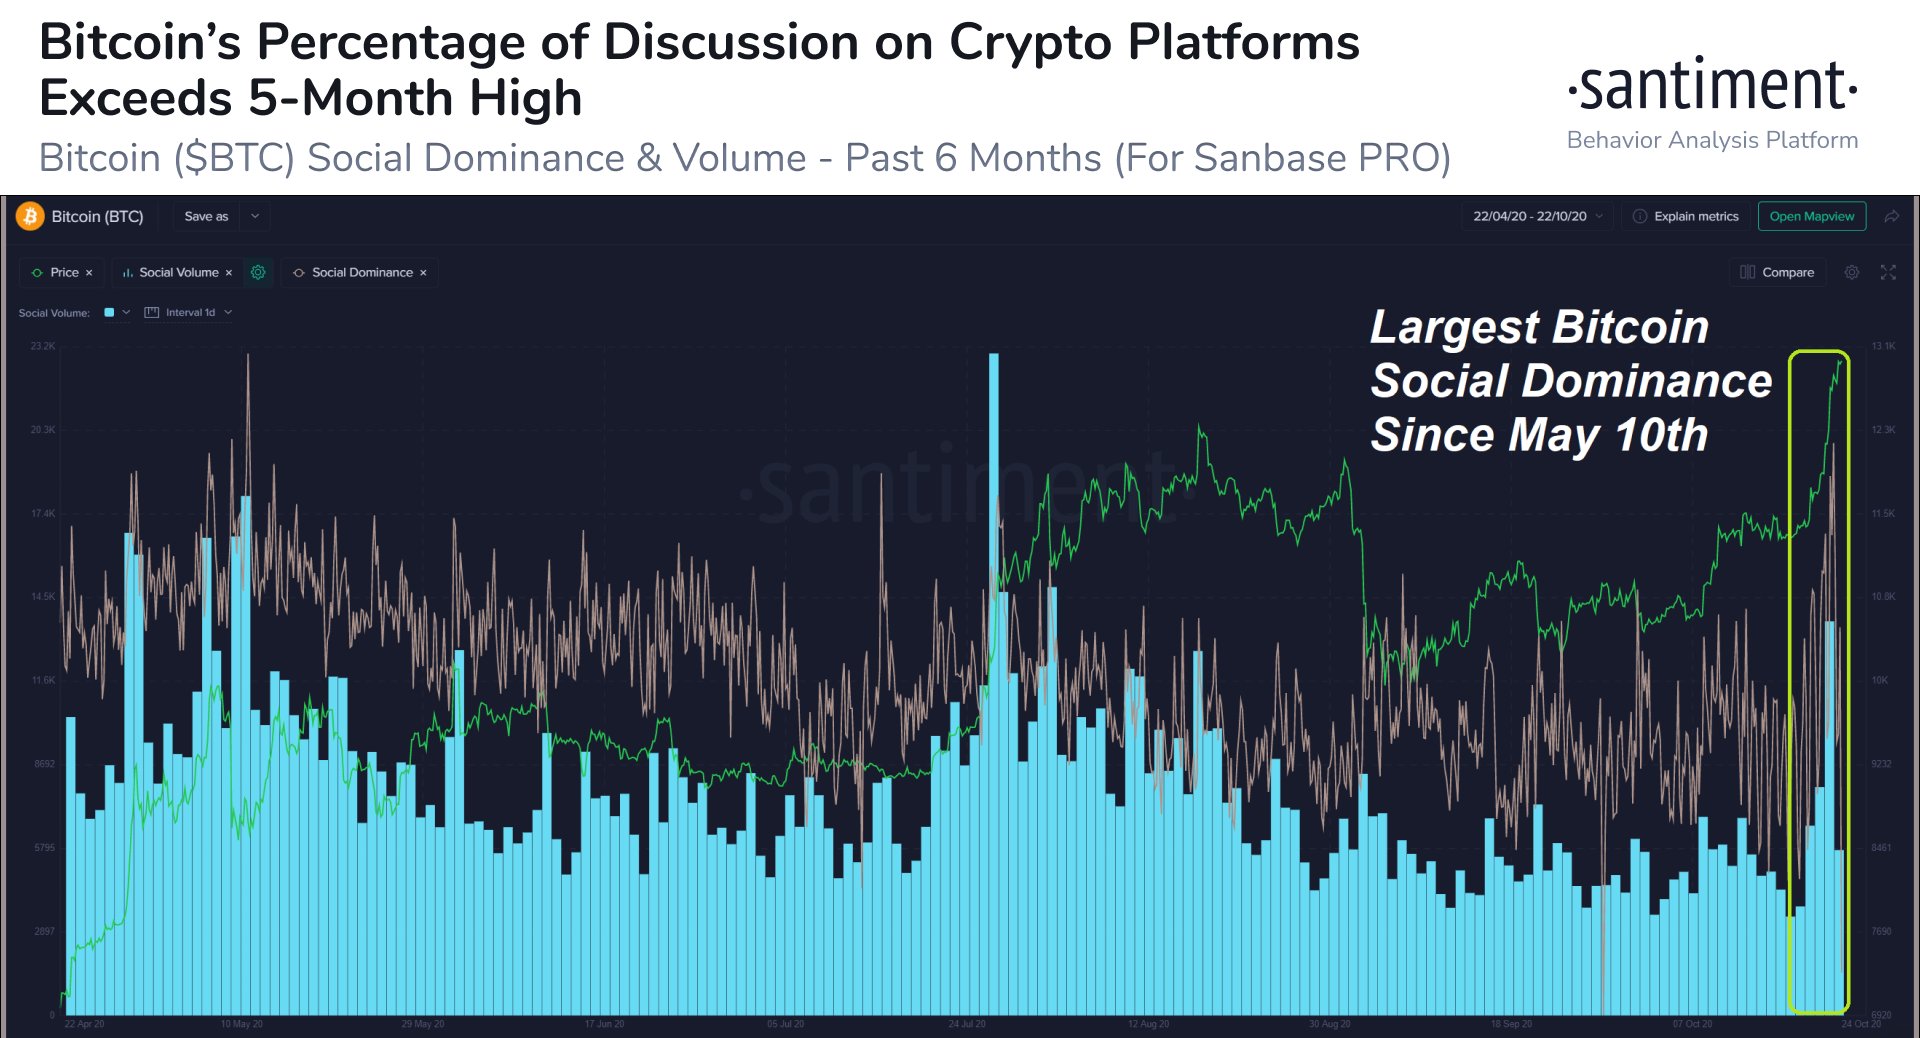
It is worth mentioning that Bitcoin’s social media mentions/volume reached its highest peak since May on Thursday. A study of this metric shows that upswings come before a price reversal.
In other words, Bitcoin will likely retreat to the support presented by the IOMAP model before another recovery comes to play. It is essential to keep in mind that the expected reversal could occur over the weekend due to the massive movement in age consumed.
Bitcoin social dominance chart
Ethereum is unable to sustain the sharp uptrend after testing $420. On-chain metrics suggests that selling pressure is building. ETH/USD path of least resistance is downwards and could retest support at $390 before a breakout comes.
Ripple is also ready to erase some of the gains made this week after stalling slightly above $0.26. Support at $0.25 could give the bulls anchorage before they attempt another breakout.