
- Bitcoin renews the bullish outlook after the dip to $11,200, trading above a symmetrical triangle.
- Ethereum loses steam at $380, paving the way for potential losses back to $360.
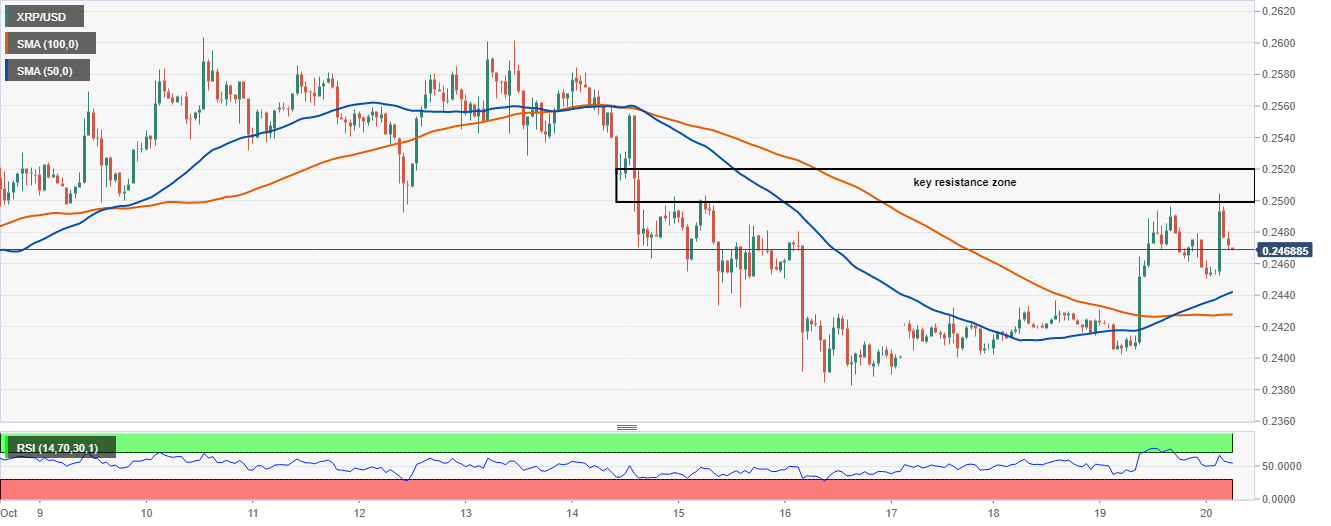
- Ripple’s path of least resistance is downwards after hitting a snag at $0.25.
The cryptocurrency market is slugging in recovery, accept for Bitcoin. Intense pressure continues to build on critical levels for major cryptocurrencies. However, Dash (DASH) is the most improved among the top 50 cryptoassets, after accruing more than 11% in gains over 24 hours.
The flagship cryptocurrency made a compelling move upwards, climbing above the resistance at $11,600 – $11,700. Ethereum’s recovery from $360 appears to have stalled at $380. On the other hand, Ripple is dealing with the selling pressure at $0.25.
The US prefers to get right with CBDCs
As the lull in the market continues, discussion surrounding central banking digital currencies (CBDCs) seems to be catching momentum worldwide. On Monday, the International Monetary Fund (IMF) and the United States Federal Reserve virtually discussed these national digital currencies’ impact.
Jerome Powell, the Fed chair, was mainly concerned with getting it right regarding launching a digital currency than being the first. He added that “getting it right means that we look at not only the potential benefits of a CBDC, but also the potential risks.“
In addition to that, a report on CBDCs published by the IMF on the same day says that while the digital currencies come with certain benefits, they are unlikely to help in all monetary issues. According to the IMF, the shift of a currency to digital “depends on the degree of monetary stability and other country circumstances, including legal frameworks and regulation.“
Bitcoin relentless fight for $12,000
The bellwether cryptocurrency cleared the earlier mentioned hurdles and the symmetrical triangle resistance on the daily chart. Bitcoin is doddering at $11,745 amid a bullish building momentum. The bullish outlook has been brought to light by the Relative Strength Index (RSI), closing in on the overbought area.
Bitcoin’s bullish case is also illustrated by trading above the 50-day Simple Moving Average (SMA). If the next obstacle at $11,800 is overcome, the flagship cryptocurrency will extend the price action past $12,000, opening the path to $13,000.
BTC/USD daily chart
IntoTheBlock’s IOMAP model adds weight to the potential rally, revealing the existence of only one seller congestion zone, $11,741 – $12,086. Here, nearly 496,000 addresses previously purchased roughly 375,000 BTC. Trading above this resistance will leave Bitcoin on a relatively smooth path to $13,000.
On the downside, immense support is highlighted between $11,374 and $11,722. Previously, approximately 2.3 million addresses bought around 1.3 million BTC. It is doubtful that declines will slice through this zone in the near term.
Bitcoin IOMAP chart
-637387753787025782.png)
Ethereum rejection at $380 spells doom
Ethereum extended its recovery to $380 after Friday’s dip to $360. Unfortunately, no progress was made to sustain the uptrend beyond this level. Instead, retreat seems to be building momentum. The RSI is holding at the midline but may well dive towards the oversold, triggering another selloff.
The smart contract token is also holding above an ascending parallel channel. If the channel support breaks, the next target is the 50 SMA in the 1-hour timeframe. Moreover, the 100 SMA is in line to absorb some of the selling pressure, if not all. Continued declines will seek refuge at $360.
ETH/USD hourly chart
-637387754488179807.png)
IntoTheBlock’s “Daily New Addresses” metric displays a significant fall in the number of newly-created addresses. The latest slump put to an end a higher high pattern that formed in mid-September. Roughly 152,400 addresses joined the network on October 19, compared to the monthly high of approximately 313,900.
The fall in network growth is a bearish sign for Ethereum in the near term. In other words, it harms the inflow and outflow of tokens. Simultaneously, liquidity is affected; hence traders must be aware.
Ethereum new addresses chart
-637387755330915447.png)
Ripple suffers another rejection at $0.25
Ripple is in the middle of a minor retreat after hitting a barrier at $0.25. The reversal comes after XRP consistently rose from last week’s support at $0.238. Trading above the 50 SMA in the hourly timeframe added gasoline to the recovery locomotive’s engine.
Meanwhile, XRP is teetering at $0.247 as bears regain control. The RSI reinforces the bearish grip as it grinds closer to the midline. If the decline continues, XRP will seek initial support at the 50 SMA. On the other hand, the 100 SMA will come in handy to help avert another lower leg to the support range between $0.238 and $0.24.
XRP/USD hourly chart
It is worth mentioning that, Santiment, a leading provider of on-chain metrics, shows a simultaneous increase in both volume and the daily activity addresses. The only lagging metric is the social volume, but as soon as it catches up with the other two, recovery will most likely come into the picture. History has shown that a massive price action follows whenever these three metrics move in the same direction.
Ripple volume/social volume/daily active addresses chart
 [09.19.50, 20 Oct, 2020]-637387755747980251.png)
Daily takeaway
Bitcoin’s bullish case is becoming apparent, but a break above $11,800 might give it a boost above $12,000. IntoTheBlock reveals an absence of selling pressure towards $13,000. On the flipside, immense support is available to ensure losses are mitigated. In the event this support, $11,374 and $11,722 is broken, Bitcoin may drop to $11,600.
Ethereum has been rejected at $380 and if the losses intensify, $360 seems to be the most probable rendezvous. The difficulty in recovery is reflected by the sharp dive in the number of addresses joining the network.
Ripple tried to slice through the resistance at $0.25 but was sent back. Support is anticipated at the 50 SMA and 100 SMA, which are likely to absorb the selling pressure. Further down, $0.24 and $0.22 will function as primary anchors.