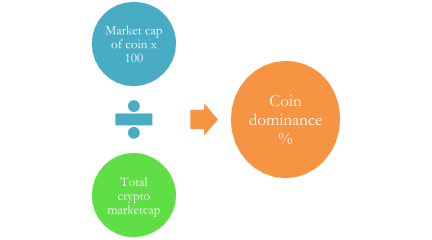
You may have heard the term Bitcoin dominance several times from professional traders. What does it mean? It’s pretty simple. If you divide the total market capital of Bitcoin by the total market capital of all cryptocurrencies and multiply the value by 100, you get Bitcoin Dominance. You can find the dominance of any coin by doing the same step.
Bitcoin Dominance
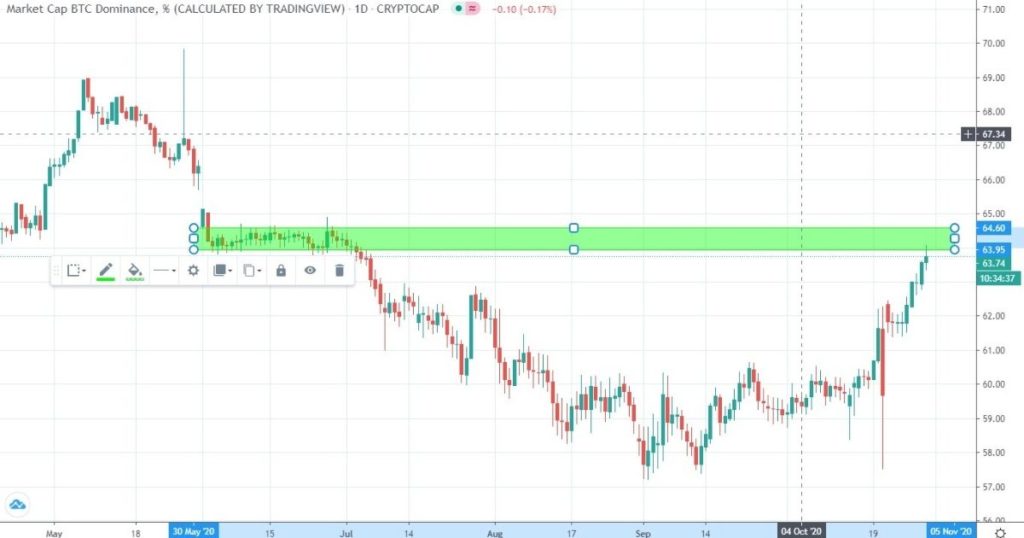
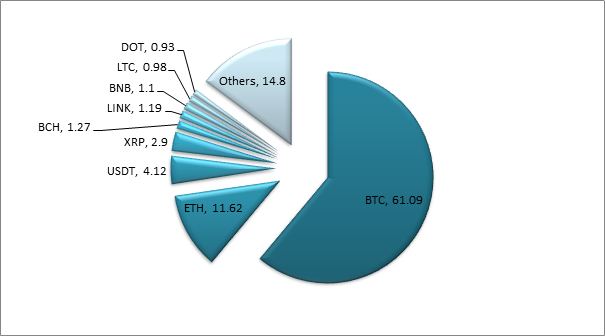
At the time of writing the article, the BTC dominance is at 64%, and it has started reaching a resistance zone. ETH dominance is at 11% while Tether’s dominance is at 4%. A fall from this zone will be good for altcoins.
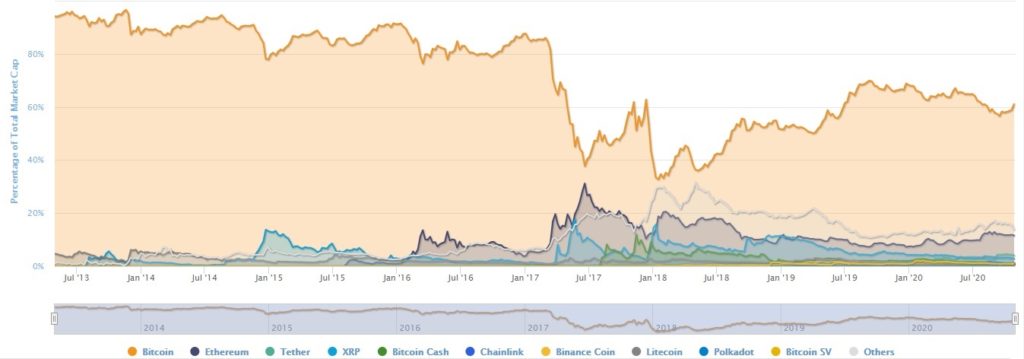
Although there are thousands of different cryptocurrencies, Bitcoin’s dominance has been above 50% for most of the decade.
What happens when BTC dominance increases or decreases?
When Bitcoin dominance increases, it means that the demand for BTC increases and that the demand for altcoins decreases. When BTC dominance decreases, it means that the demand for altcoins increases and that the demand for BTC decreases.

When BTC dominance increases, it means that investors in crypto are looking for a less volatile and safer investment. It is analogous to buying A-list stocks or YEN in forex or gold in commodities. During market uncertainty, investors shift towards less volatile and highly liquid assets like BTC rather than investing in altcoins with low liquidity and market cap. There are multiple reasons for the high dominance of Bitcoin, which include: earliest digital asset, listed across all exchanges, completely decentralized, extreme media attention, etc. This is the reason most traders in cryptocurrency have begun their journey by BTC as the first cryptocurrency.

When BTC dominance decreases, it indicates the beginning of alt season. It is an indication that the profits earned from the rise in price of BTC will now be used to buy altcoins. A falling BTC dominance is a good sign for altcoins. Altcoins have a much higher probability of exponential gains given their low liquidity and high volatility compared to BTC. To give an example, it is far more likely for an altcoin like BAND to jump from $5 to $15 in a much shorter time frame than for BTC to jump from $10,000 to $30,000 in the same time frame.

History of Bitcoin dominance
Since the introduction of an additional 10 cryptocurrencies, BTC dominance has been mostly above 50% in terms of market dominance. Until November 2014, BTC dominance was above 90%. After the introduction of XRP, the dominance started falling and reached 78% when XRP dominance was at 13% during the first altcoins season.
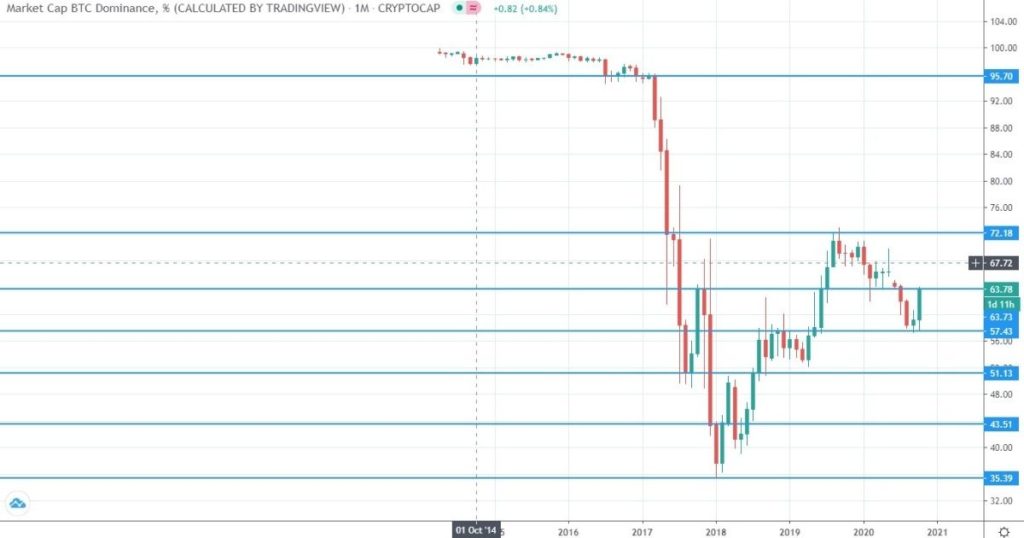
The dominance of BTC crawled back towards 90% in the beginning of 2016 until ETH got listed across exchanges, which took 13% of the market cap and led the dominance of BTC to drop down to the 70s before it again started crawling back up.
The major drop in BTC dominance was in mid-2017 when Ether became extremely popular and it started looking like it can dethrone BTC.
BTC dominance fell to 38% while ETH dominance peaked at 31% in June 2017.
During this period, we saw massive gains in many altcoins, and this was one of the most euphoric eras of altcoins as well as BTC. We saw BTC reach its all-time high price of almost $20,000 and many altcoins reached their all-time high price until the beginning of the “crypto winter” in January 2018. We saw many coins doing more than 10x in a short span of time, which was also known as the era of “ICOs.” During this massive altcoin rally, BTC dominance fell down to its all-time low value of 32%.
Today’s market cap:
Summary
Bitcoin dominance is an extremely important parameter for traders and investors.
It marks the beginning or end of altcoins season.
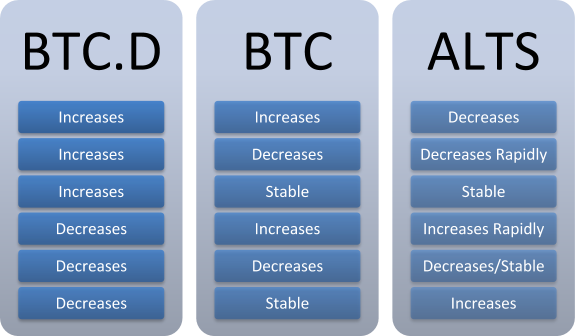
Here is a tabular summary of the relationship between BTC’s dominance, BTC’s price, and altcoins’ price.