- XRP/USD retreats from psychological resistance of $0.3000.
- The technical correction may be limited by $0.2840.
Ripple’s XRP hit the intraday high at $0,2959 and retreated to $0,2930 by the time of writing. The third digital asset has bottomed at $0,2547 hit on August 27, and started the recovery with the critical resistance created by the psychological $0,3000. XRP/USD has gained over 4% both on a day-to-day basis and since the beginning of the day.
XRP/USD 1-hour chart
On the intraday charts, XRP/USD attempts to move back inside the 1-hour Bollinger Band with the next support created by $0.2900. It is followed by the upper line of the previous consolidation channel at $0.2840, which is reinforced by the middle line of the 1-hour Bollinger Band. Considering that the RSI has reversed to the outside, ready to exit the overbought territory, XRP may extend the correction towards the above-mentioned area.
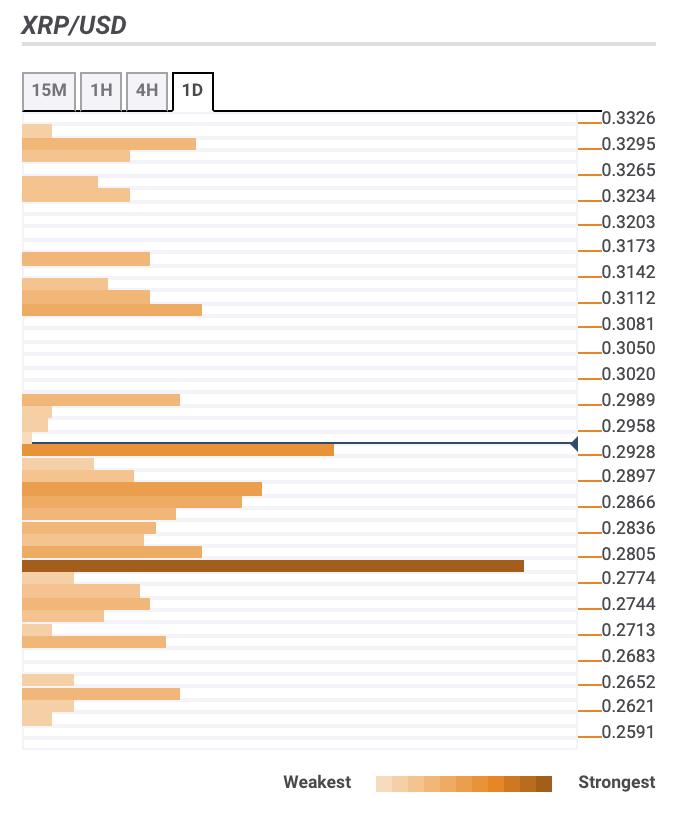
Ripple confluence levels
The majority of technical barriers are clustered both below the current price, which means the price may be better positioned for further recovery. Let’s have a closer look at support and resistance levels for XRP/USD.
Resistance levels
$0.2990-$0.300 — 38.2% Fibo retracement monthly, psychological level
$0.3100 — 23.6% Fibo retracement monthly
$0.3300 — Pivot Point 1-week Resistance 3
Support levels
$0.2880 — the middle line of the daily Bollinger Band, the upper line of the 4-hour Bollinger Band, 4-hour SMA200.
$0.2800 — 1-hour SMA200, 4-hour SMA50, 61.8% Fibo retracement weekly and monthly, the middle line of the 4-hour Bollinger Band
$0,2700 — 38.2% Fibo retracement weekly
XRP/USD, 1-day