
- XRP is currently trading at $0.232 after losing a critical support level in the form of the 200-SMA.
- The MACD indicator also turned bearish on the 12-hour chart, further showing the weakness of XRP.
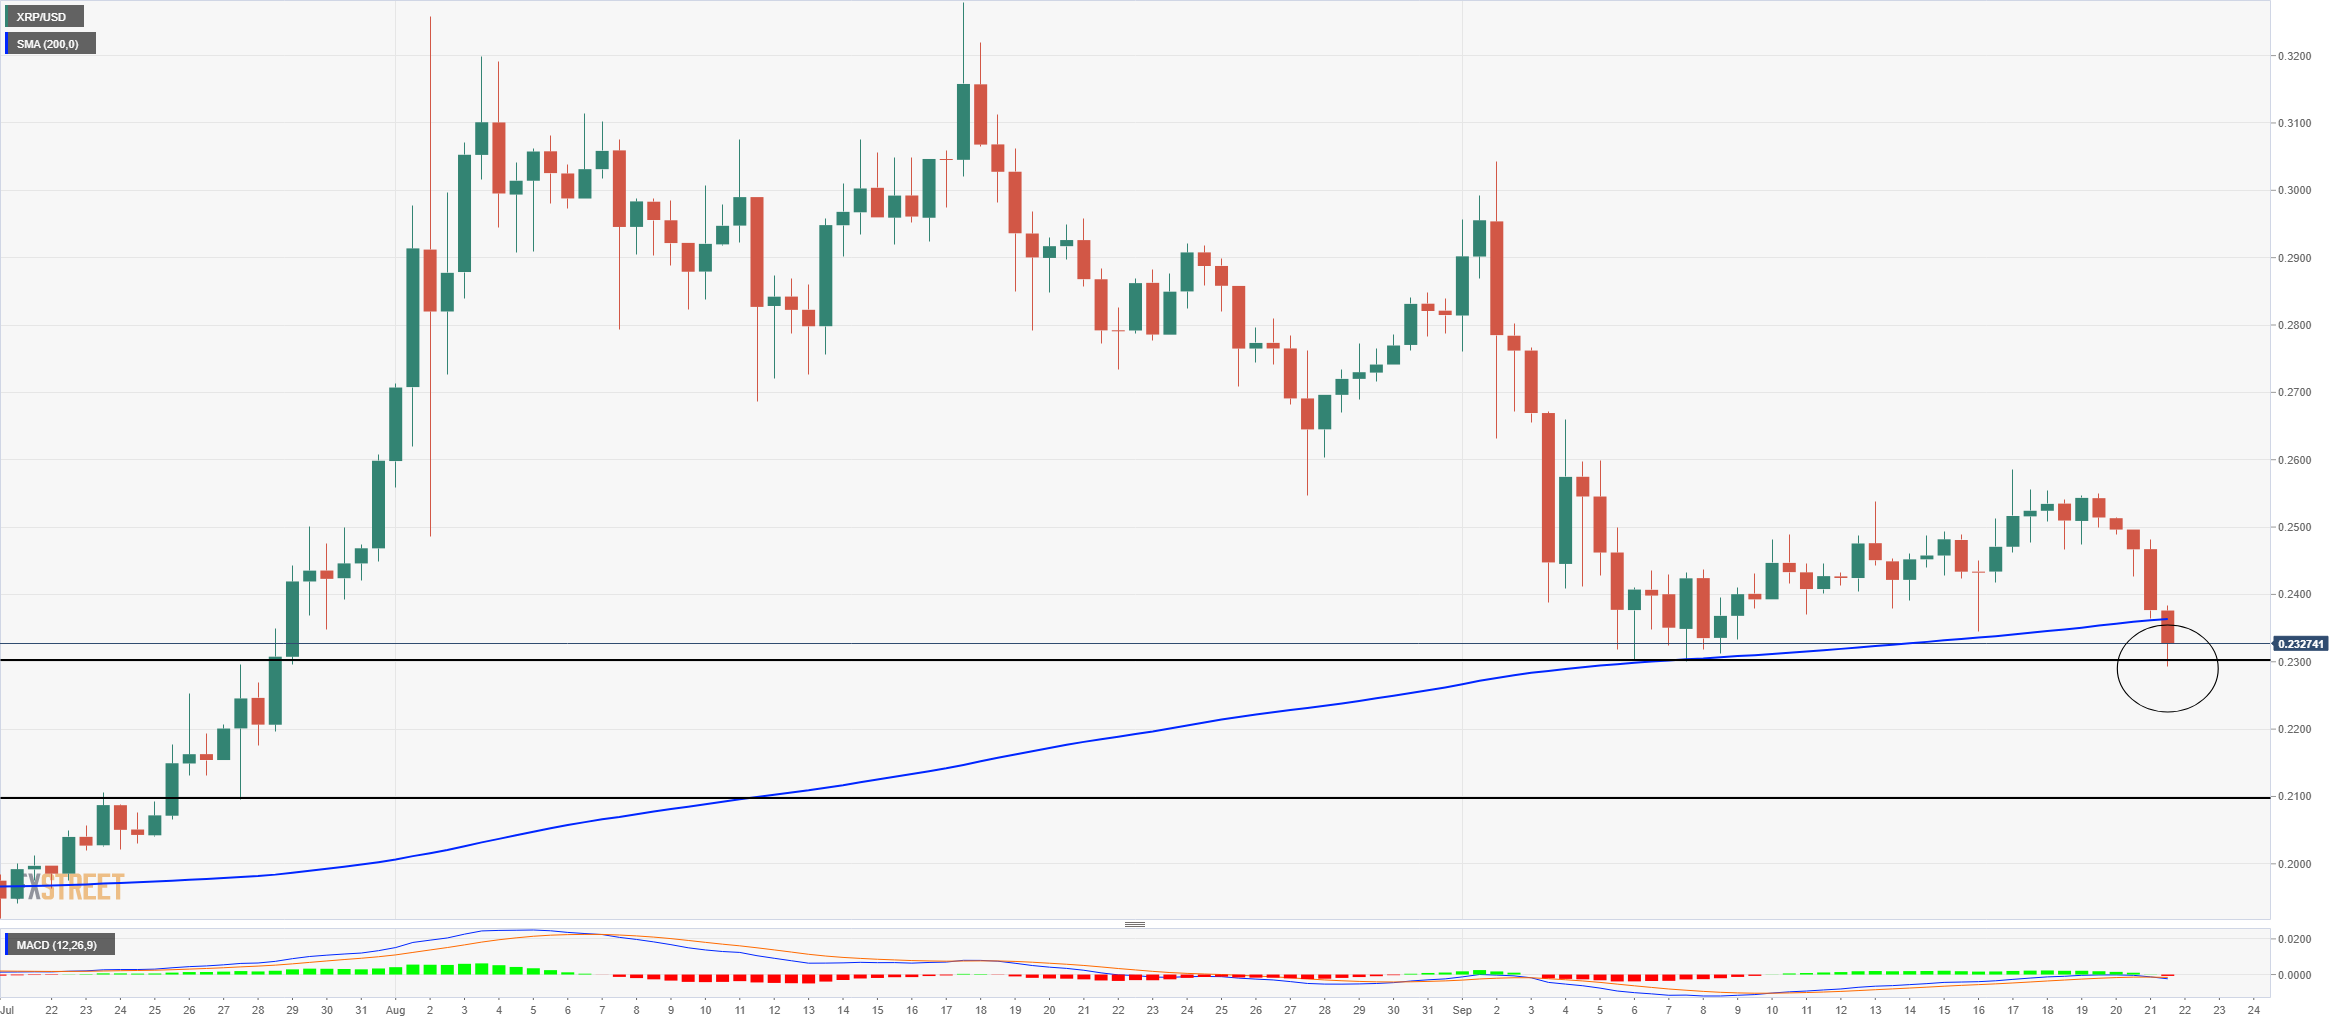
XRP is down 30% from its peak at $0.327 on August 17. The digital asset has been in a downtrend ever since, after forming a double top into the break of support.
XRP/USD 12-hour chart
The cross-border giant was on its way to forming a 12-hour uptrend; however, it recently plummeted, destroying all the support levels nearby, including the 200-SMA at $0.236.
Bulls are now defending the area of support around $0.23, as it was a level held on September 6 after the initial crash. The MACD has also just turned bearish, which indicates XRP is poised for another leg down, possibly into $0.21, the next level of support.
 [22.12.34, 21 Sep, 2020]-637363161189581501.png)
On the flip side, the holders distribution chart from Santiment shows that holders with at least 1,000,000 XRP and up to 10,000,000 are increasing. The number of whales was as low as 1,327 two days ago but has now notably increased to 1,342, which means 15 new whales hold at least 1,000,000 XRP coins.
If XRP can bounce above the 200-SMA and close there, the digital asset could be looking at a target price of $0.25, which is the last local top. The most critical support level remains at $0.23, while resistance is at $0.236 in the form of the 200-SMA.