
Investors primarily treat Bitcoin (BTC-USD) as a scarce asset which lends itself to a number of valuation approaches that appear to work reasonably well. Ethereum (ETH-USD) is a smart contract platform where value is determined by the applications built on the platform and as a result, a valuation of Ether should be based on an estimate of the economic activity occurring on the Ethereum platform. There is considerable uncertainty in this approach though and the following questions must be answered:
- How long will it take for decentralized applications (DApps) to become widely adopted?
- How much economic activity will be conducted using DApps?
- What will Ethereum’s share of the DApp market be?
- What will the total supply of Ether tokens be?
- What discount rate to use?
In addition, it is unclear whether Ether should be valued as a currency or as a token with ownership properties. At first glance it may appear clear that blockchain tokens do not resemble equity ownership but the classification of a token is actually quite blurred depending on the blockchain. Shareholders have the right to:
- Share in the company’s profitability, income, and assets
- A degree of control and influence over the selection of management
- To vote at general meetings
A Proof-of-Stake (PoS) blockchain using on-chain governance closely resembles equity ownership as token holders can directly benefit from transactions occurring on the platform and can vote on governance issues. Blockchains with off-chain governance and Proof-of-Work (PoW) more closely resemble a currency as there are no voting rights or direct benefit from transactions. In addition, token holders have no right to legal recourse, but I believe this is generally a small component of the value of ownership. Many tech companies have common shares with worthless voting rights and often do not generate profits, or if they do, hoard profits rather than distribute them to owners. To be clear, I do not believe Ether tokens represent ownership of the Ethereum network, it is a question of whether Ether’s properties justify treating it like equity ownership for valuation purposes.
This distinction is important as it will likely determine the relationship between economic activity on the Ethereum platform and the value of Ether tokens. If Ether is treated purely as a currency it can be valued using the equation of exchange. This requires an estimate of economic activity on the Ethereum network and estimates of Ether’s supply and velocity. If Ether is treated as something akin to an ownership token it can be valued assuming tokens directly reflect the value of economic activity on the Ethereum network.
Timeline
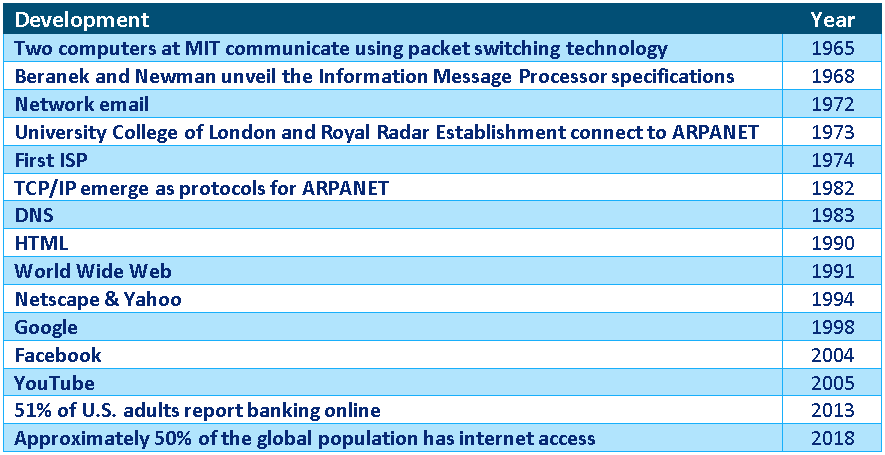
Decentralized blockchains are a significantly different way of organizing and incentivizing economic activity and as a result it is likely to take several decades for their full impact to be felt, assuming they do become widely adopted. The internet offers an illustrative comparison as it is easy to ignore its long history. The internet did not suddenly emerge in the mid-90s and transform the global economy in a decade, there were several decades of development before the necessary technologies and protocols were in place for consumer adoption. Based on the development of the internet it could take until 2040-2050 before blockchain technology takes its final form and begins to have a large impact on society and the economy. For the purposes of valuation I have conservatively assumed that Ethereum will not reach full market penetration until 2045.
Table 1: History of the Internet
(Source: Created by author using data from livescience)
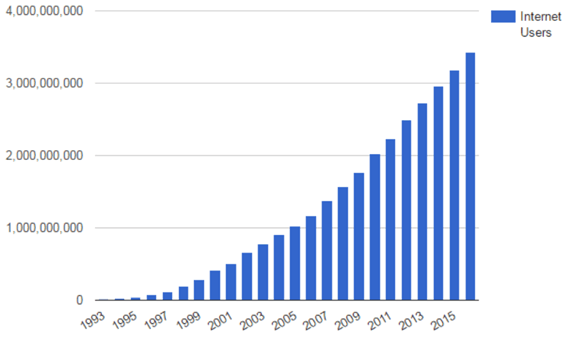
Figure 1: Number of Internet Users Globally
(Source: rethinkyourphone)
Decentralized Economic Activity
Decentralized economic activity could be estimated using a top-down approach by assuming a total amount of global economic activity and by assuming the percentage captured by decentralized applications or through a bottom-up approach estimating the market size for specific use cases. Given the difficulties of trying to predict specific use cases and estimate future market values, I have used a top down approach.
Research from McKinsey shows that the public sector, financial services and technology, media and telecom are the sectors where blockchains are likely to have the largest impact and are also the most feasible. I have assumed that blockchains will be adopted in these sectors but will have no penetration in the other sectors where the feasibility and impact is expected to be lower.
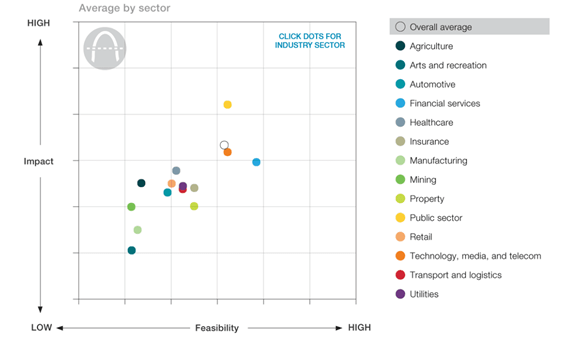
Figure 2: Blockchain Opportunities by Industrial Sector
(Source: McKinsey)
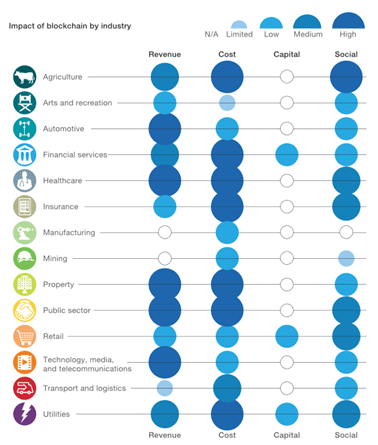
Figure 3: Impact of Blockchain by Industry
(Source: McKinsey)
The digital economy, financial services and the public sector are all significant contributors to GDP and the contribution of these sectors has generally been increasing over time.
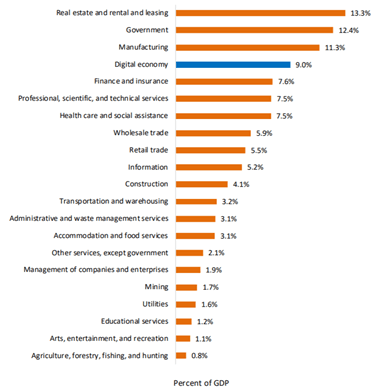
Figure 4: U.S. GDP Share by Sector 2018
(Source: BEA)
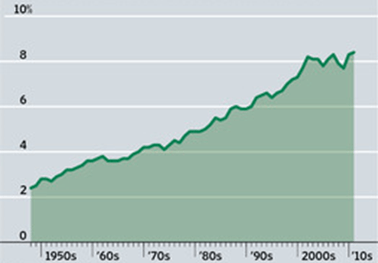
Figure 5: Financial Sector’s Share of GDP
(Source: The Wall Street Journal)
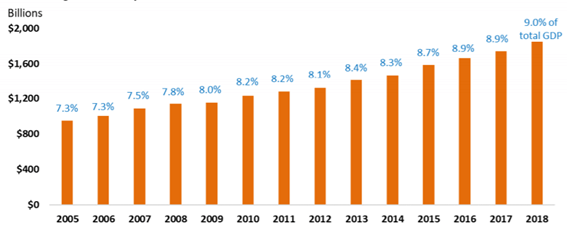
Figure 6: U.S. Digital Economy Share of GDP
(Source: BEA)
A World Economic Forum survey suggested that 10% of global GDP will be stored on blockchain by 2027. Research from Gartner has found that blockchain-focused initiatives will generate some $3 trillion in business value annually by 2030. I am estimating 0.8% of global economic activity will be conducted on decentralized blockchains by 2045 which is relatively conservative in comparison. I believe this is prudent given it is uncertain to what extent blockchains will be adopted and in particular how prevalent permissionless blockchains will be relative to permissioned blockchains.
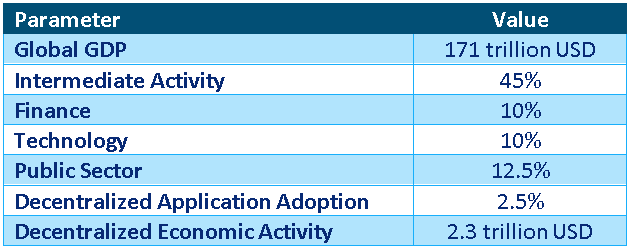
Table 2: Estimate of Decentralized Economic Activity 2045
(Source: Created by author)
Ethereum Market Share
Ethereum is clearly the leading smart contract platform at the moment, although it could face stiff competition in the future from platforms with differentiated technology. At this stage it is probably reasonable to assume that market capitalizations are a reasonable proxy for future share of DApp markets.
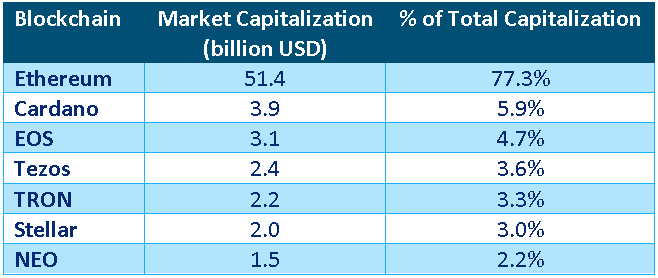 Table 3: Smart Contract Platform Market Capitalizations 1-Sept-2020
(Source: Created by author using data from coingecko)
Alternatively, the current distribution of DApps across platforms could be used as a proxy, but this ignores the potential of platforms which are still developing and do not have a significant number of applications built on them yet.
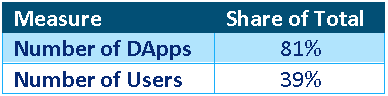
Table 4: Ethereum Market Share
(Source: Created by author using data from stateofthedapps)
It is possible that Ethereum will end up with a small market share as there will be intense competition from alternative platforms. Ethereum’s open-source nature also allows for easy replication and there is the potential for hard forks to increase competition. Competition amongst protocols is likely to be similar to competition in the traditional economy. Investors must consider supply side economies of scale, specialization, economies of scope, productivity gains through experience, demand side economies of scale, etc. Consideration of blockchain market forces is also needed as dominant applications could commoditize the underlying protocol layer and interoperability software could help to prevent monopolization of the protocol layer.

Figure 7: Competition Minimizing the Value of Individual Protocols
(Source: openzeppelin)

Figure 8: Competition Minimizing the Value of Individual Protocols
(Source: openzeppelin)
While there will always be the potential for hard forks, I do not believe these are a serious threat as it is generally not in the interest of developers to fork a project. When hardforks do occur, past experience shows that the chains are not equals, one chain is dominant.
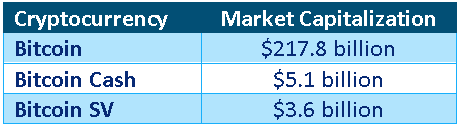
Table 5: Bitcoin Hard Forks 1-Sept-2020
(Source: Created by author using data from coingecko)
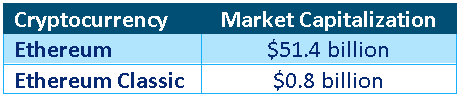
Table 6: Ethereum Hard Forks 1-Sept-2020
(Source: Created by author using data from coingecko)
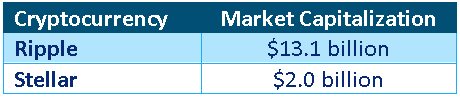
Table 7: Ripple Hard Forks 1-Sept-2020
(Source: Created by author using data from coingecko)
Ethereum faces real competition from alternative smart contract platforms, some of which may develop superior technology. Ethereum has a clear lead at the moment but until a smart contract platform resolves the security/scalability/decentralization trilemma the future market leader will remain uncertain. Network effects and the need for liquid marketplaces should lead to a winner take all or winner take most outcome, although interoperability could level the playing field. In addition, the need for a secure protocol layer is likely to result in a concentrated market. With a PoS consensus it is the market capitalization that determines the security of the network which should lead to the network with the highest market cap being the most secure and the most secure network becoming the dominant protocol.
Value Capture
In a blockchain economy there is a technology stack with decentralized applications at the top and a protocol layer like Ethereum at the bottom. The internet technology stack is similar and most of the value is captured at the application level (e.g. Facebook (NASDAQ:FB)). Internet protocols like HTTP, TCP/IP and SMTP created a huge amount of value but they were unable to capture this value. It has been argued that the protocol layer (e.g. Ethereum) will capture most of the value in the blockchain stack as it acts as a shared data layer which removes the competitive advantage of applications.
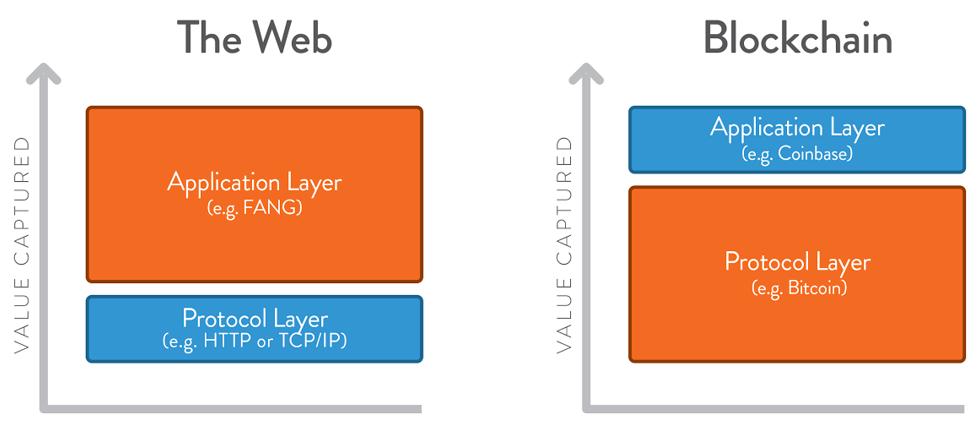
Figure 9: Value of Applications versus Protocols
(Source: hackernoon)
So far, this has proven to be the case but it is unclear whether this will continue as blockchain economies evolve. If value ends up being captured at the application layer, it will manifest in the form of a low “take rate” or high velocity for Ether tokens.
Ethereum Take Rate
The value of Ether tokens is likely to reflect the utility of the platform but there is no fiat currency revenue stream to perform a true valuation. In a PoS system knowing the staking rewards that will be received from holding Ether tokens does not help determine the value of Ether tokens in USD, unless an interest rate parity framework were to be used. For the purpose of this valuation, it is assumed that the value of Ether tokens is derived as if there was a fee on transactions on the platform which is distributed to token holders.
Platform take rates vary widely and are dependent on the services offered by the platform and who has control of the relationship with end users. Ethereum is more akin to a payment network than consumer-facing platforms and the amount of value it captures from transactions is likely to reflect this.

Figure 10: Tech Platform Take Rates
(Source: Ark Investment Management)
I have assumed a “take rate” of 1% but this is a key uncertainty given the nature of the platform.
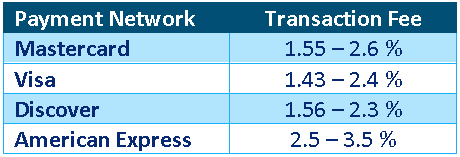
Table 8: Payment Network Transaction Fees
(Source: cardrates)
Ether Supply
There is no hard cap on the supply of Ether, although there is a proposed supply schedule. The current outstanding amount of Ether is approximately 112 million and I have used a value of 185 million.
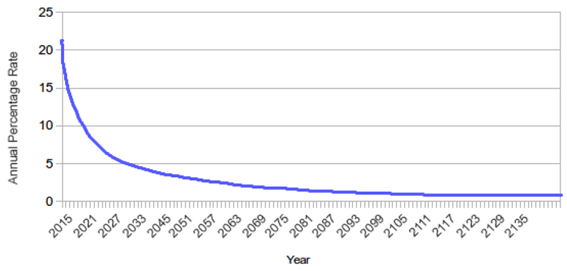
Figure 11: Ether Supply Schedule
(Source: Ethereum White Paper)
Ether Velocity
To determine Ether’s velocity, an estimate of the price and quantity of transactions in the Ethereum ecosystem is needed. This is very small at the moment and as such the money velocity for cryptocurrencies is extremely low. The estimates below are calculated from the value of DApp transactions excluding exchange DApps and hence are much lower than many estimates, but also more comparable to money velocity calculations for the real economy which do not include foreign exchange transactions.

Equation 1: Velocity Calculation
(Source: Created by author)
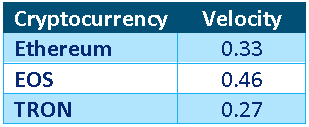
Table 9: Estimate of Ether Velocity
(Source: Created by author using data from stateofthedapps)
The money velocity for the U.S. economy is largely dependent on how broad a measure of money is used as well as other factors like interest rates and supply growth. For the purpose of valuation, a velocity of 10 has been assumed for Ether as this is a relatively high measure for a narrow measure of money like M1.
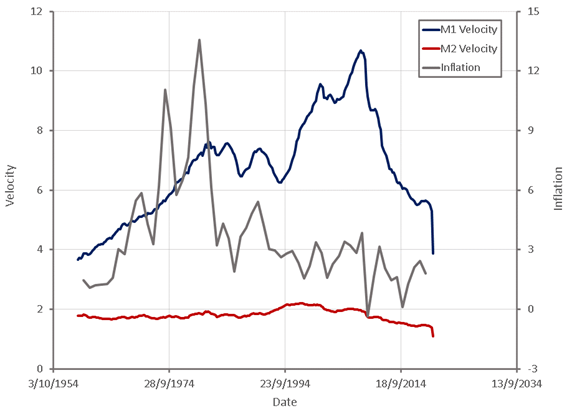
Figure 12: U.S. Money Velocity
(Source: Created by author using data from The Federal Reserve)
Discount Rate
Ethereum is an inherently risky investment and this risk can be accounted for by either using a high discount rate or conservative projections. It should also be noted that Ethereum’s risk is idiosyncratic and so the contribution to the risk of a well-diversified portfolio should be somewhat muted despite Ethereum’s high volatility.
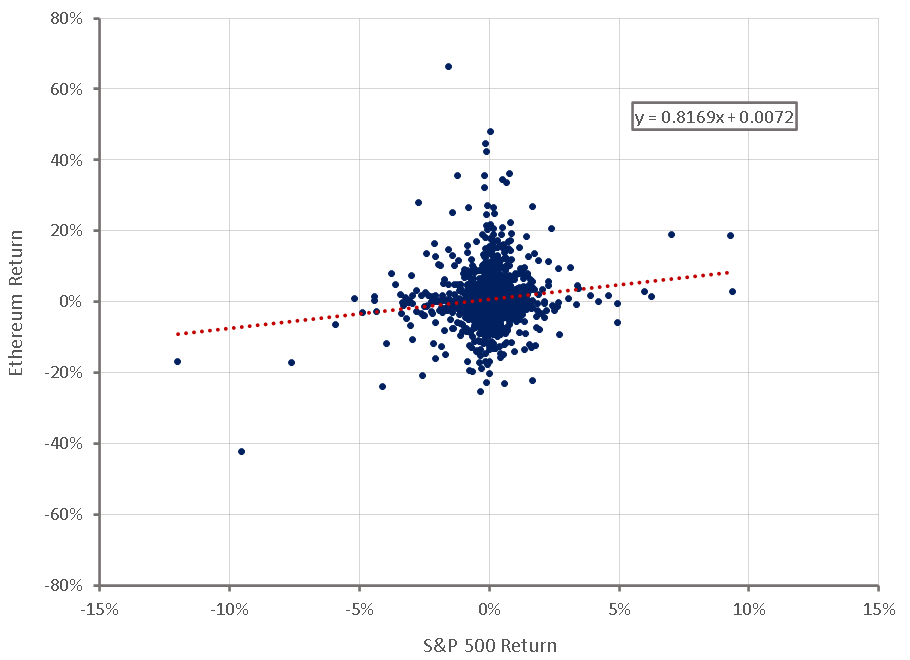
Figure 13: Ethereum Beta Estimate
(Source: Created by author using data from Yahoo Finance)
I have used a moderate risk premium based on high-yield spreads on top of the equity cost of capital to reflect Ethereum’s risk of failure in the long run.
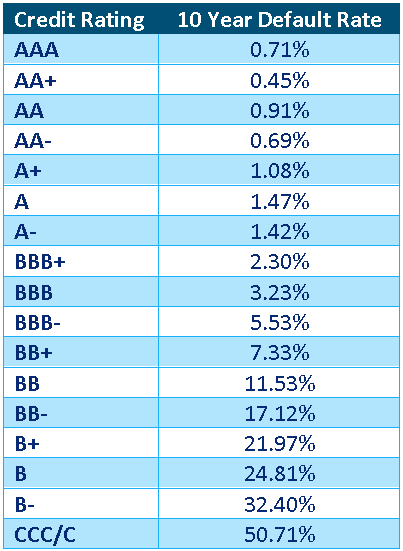
Table 10: Corporate Bond Default Rates by Credit Rating 1981-2017
(Source: livewiremarkets)
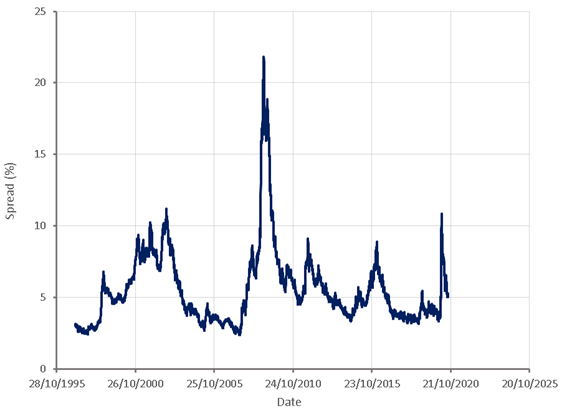
Figure 14: U.S. High Yield Index Option-Adjusted Spread
(Source: The Federal Reserve)
Many people would consider the discount rate below too low for a speculative investment like Ethereum. I do not necessarily disagree but I prefer to use conservative estimates for outcomes rather than an excessively high discount rate. This is particularly important in a case like Ethereum where it will likely take at least several decades for the technology to realize its full potential as a high discount renders all but the most extreme positive outcomes worthless over a long enough time frame.
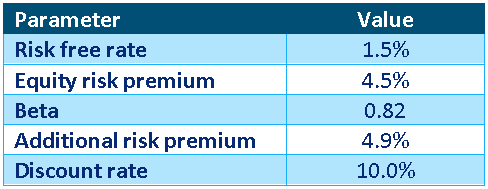
Table 11: Ethereum Discount Rate Estimate
(Source: Created by author)
Value
I have performed a Monte Carlo simulation using the parameters above, in addition to estimated parameter distributions, to give an indication of the likely range of Ether’s value. The distribution of values should not give a false sense of confidence in this approach. The results are only as good as the inputs and the accuracy of the assumptions used in the modelling. Although the ownership token approach is similar to a discounted cash flow valuation, it is not. There are no assumed cash flows, only an assumption that Ether’s value is reflective of the value of economic transactions on the platform.
The ownership token approach yielded an average value of 475 USD and a median value of 125 USD compared to an average value of 210 USD and a median value of 37 USD for the currency approach. I personally think that 100 USD or below is an attractive entry point and wouldn’t consider purchasing above 1,000 USD. In my opinion the small likelihood of extremely positive outcomes makes Ethereum an attractive speculative investment opportunity.
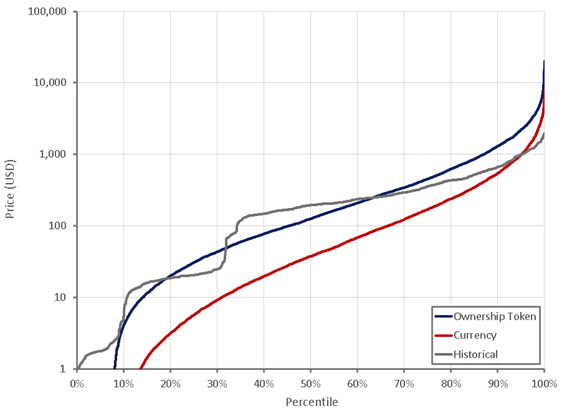
Figure 15: Ethereum Estimated Value Distribution
(Source: Created by author using data from coingecko)
Disclosure: I am/we are long ETH-USD, BTC-USD. I wrote this article myself, and it expresses my own opinions. I am not receiving compensation for it (other than from Seeking Alpha). I have no business relationship with any company whose stock is mentioned in this article.