
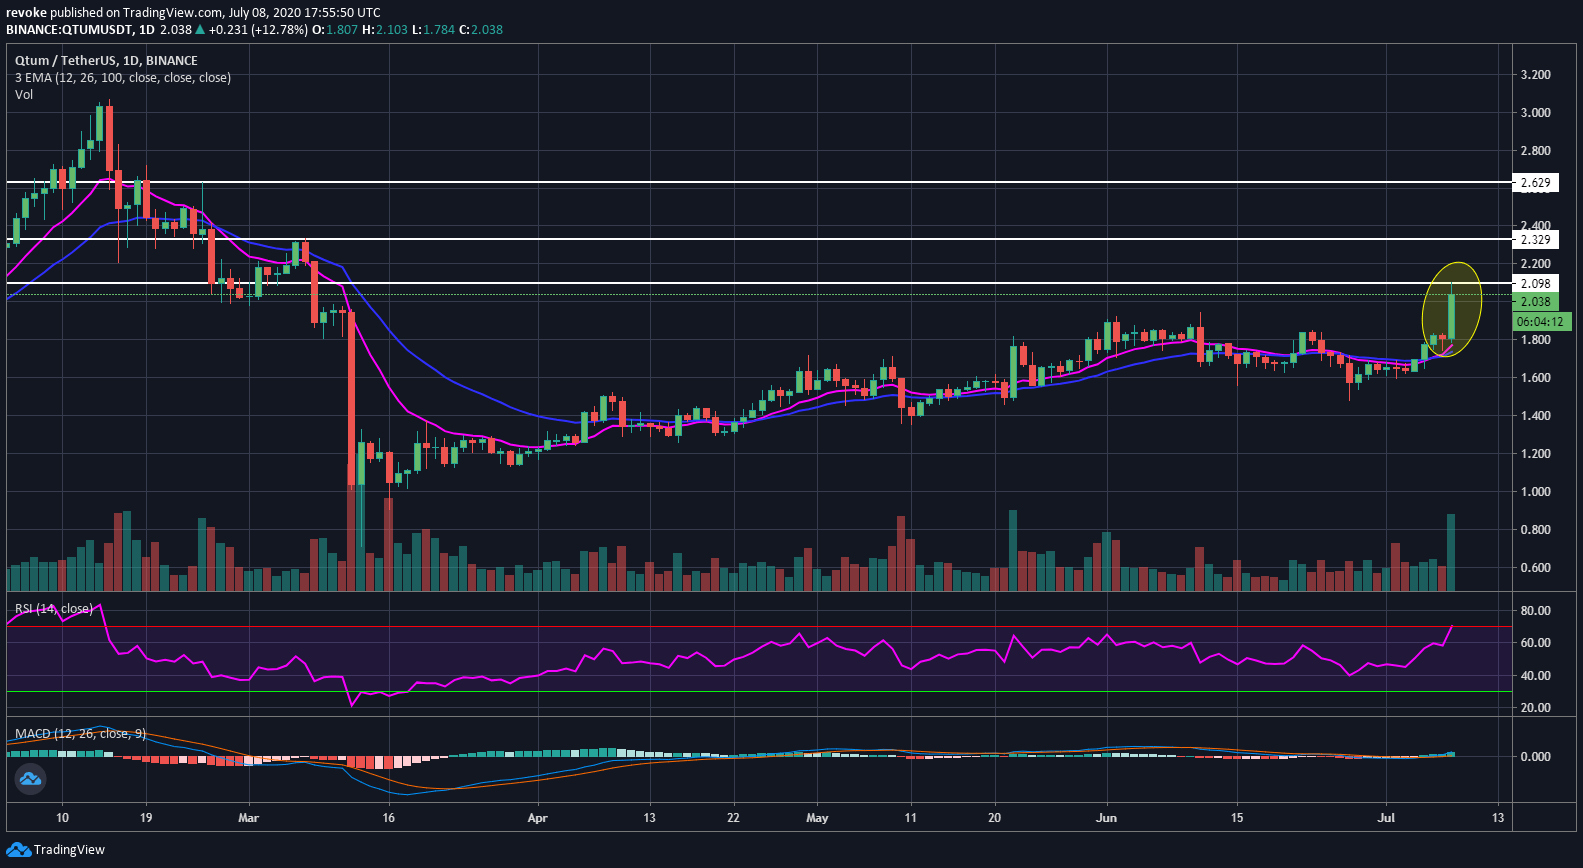
- QTUM/USD breakout destroyed several daily resistance levels.
- Qtum managed to climb above $2 and hit $2.1 on Binance.
Qtum was relatively flat as most of the market until July 8. The breakout put QTUM above $2 and broke the resistance level at $1.84 and $1.94, as well as, 2$ psychological level. This recent bull move only puts QTUM at the level it was before the crash on March 12.
QTUM/USD daily chart
The 12-EMA and the 26-EMA have crossed bullishly on July 6 and the MACD on July 5. The daily RSI is on the verge of being overextended and could indicate a short-term pullback after such a significant bull break. The next resistance level is all the way up at $2.33 and $2.62. The overall trading volume is a monthly high.
QTUM/USD 4-hour chart
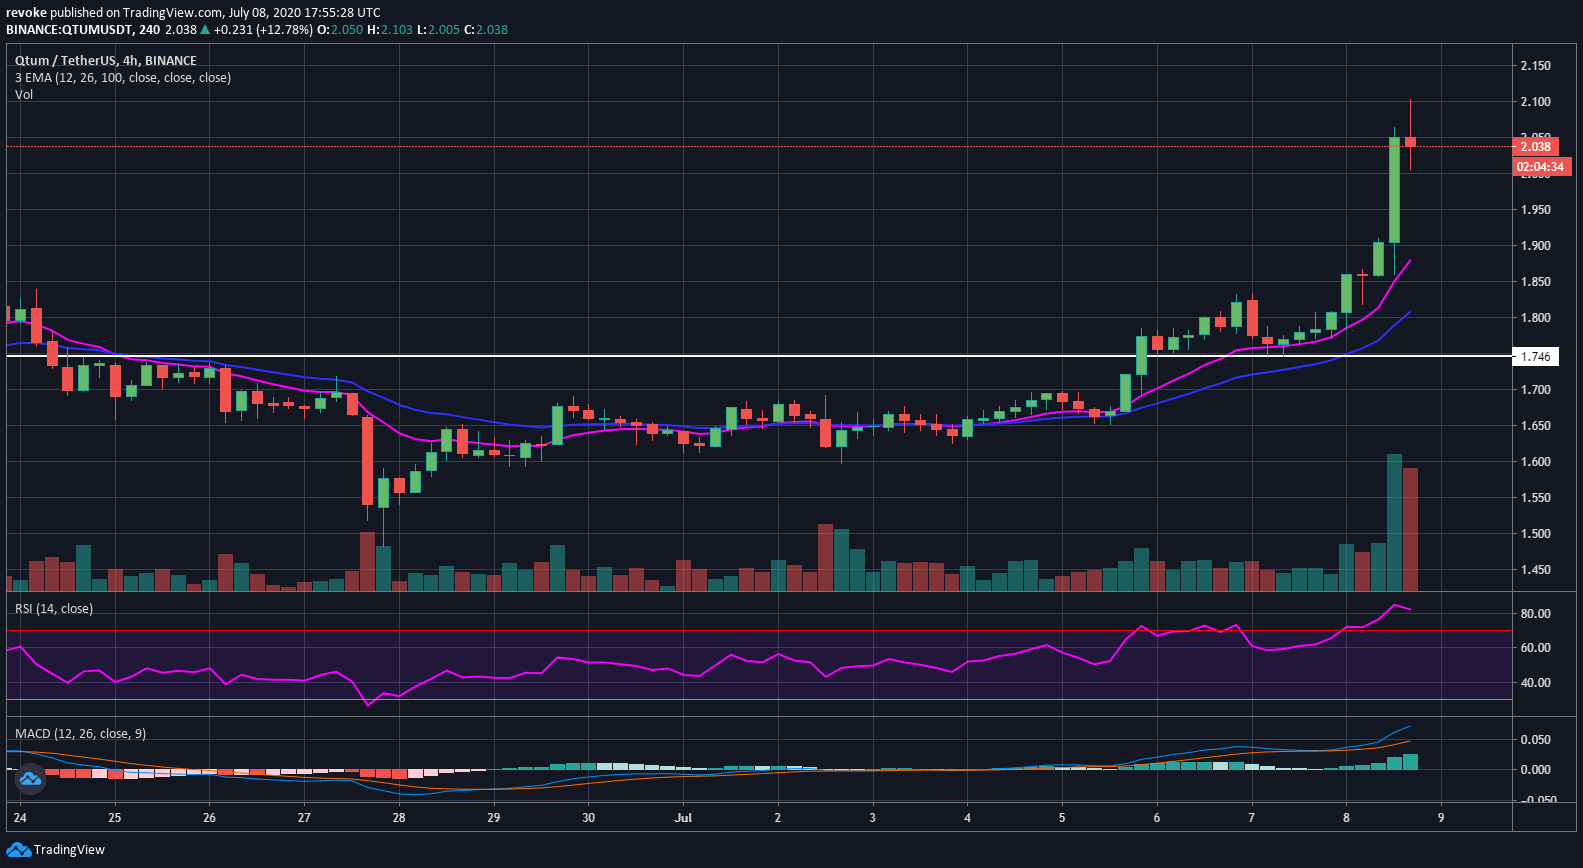
The RSI is extremely overextended and QTUM is already under some consolidation. Bulls can use $2 as a support level followed by the 12-EMA, currently located at $1.87. The critical support level to hold is $1.74, the last low of the 4-hour uptrend.