
LTC/USD Price Technical Outlook
Indecisive Traders
On Tuesday, Litecoin rallied to an over four-week high at $49.90 yet the price pulled back later as some bulls seemed to cut back. Therefore, the weekly candlestick closed with a Doji candlestick reflecting the market’s indecision at this stage.
This week, the Relative Strength Index (RSI) remained flat above 50 highlighting a paused bullish momentum.
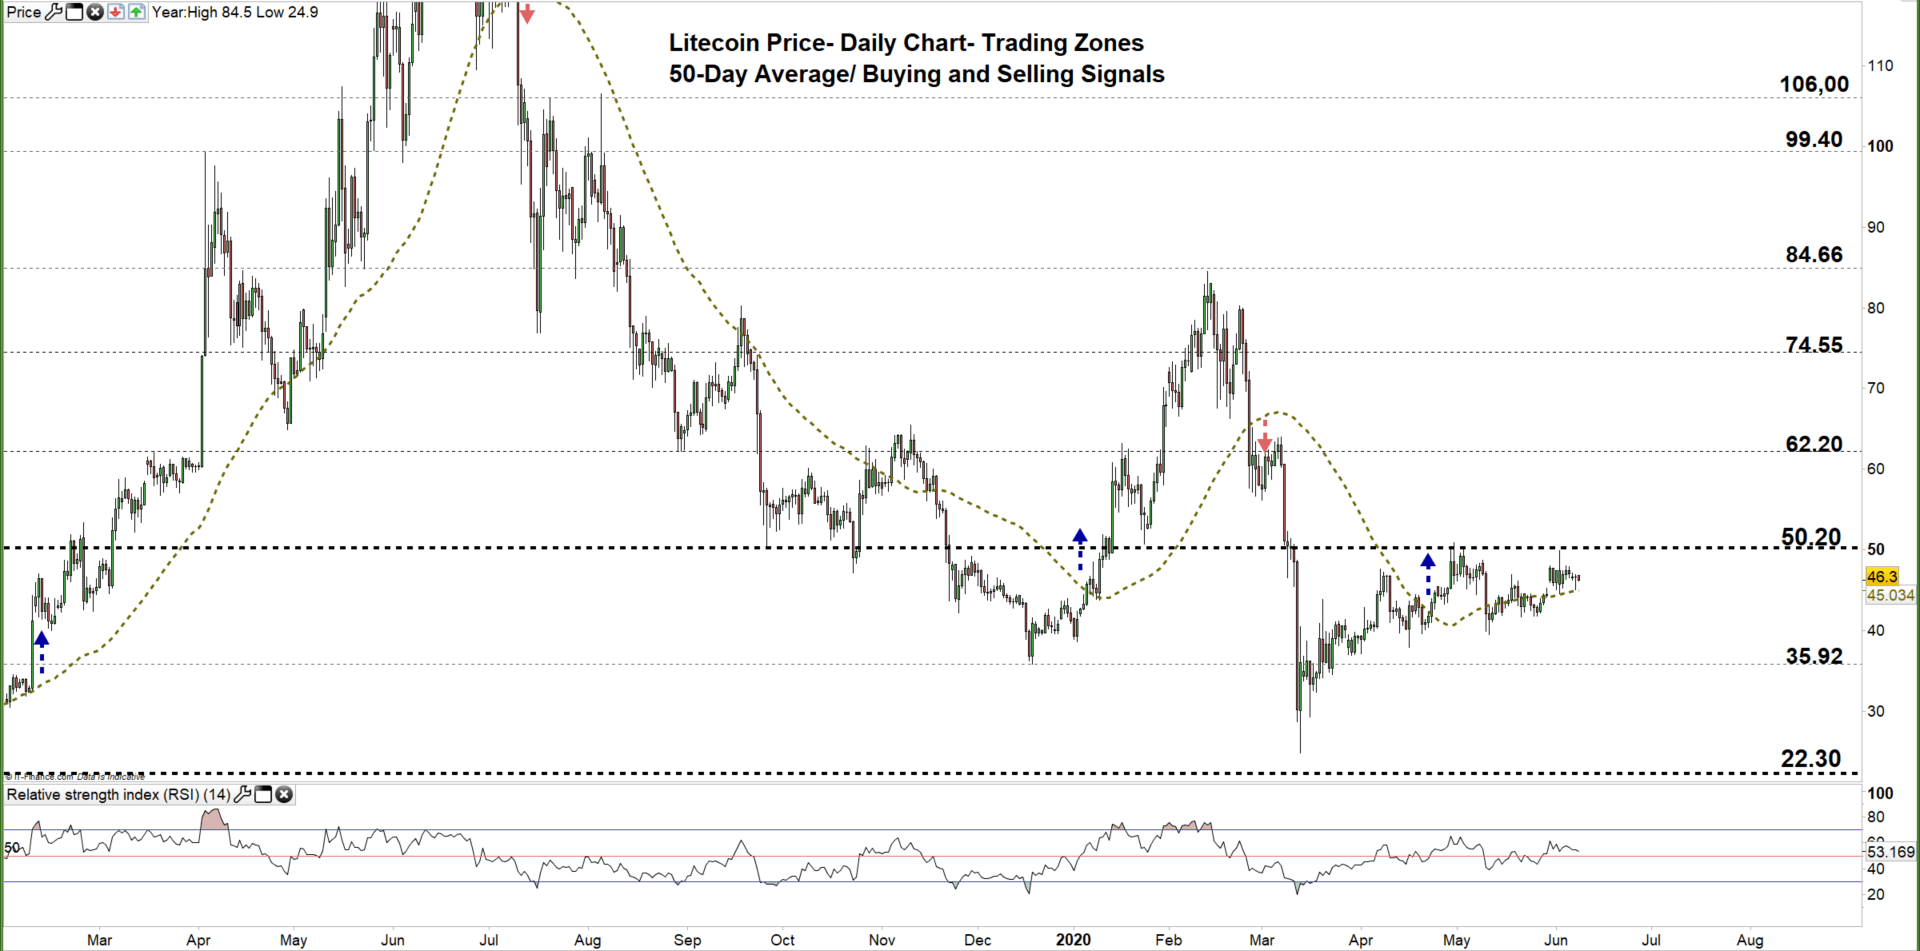
Litecoin PRICE DAILY CHART (FEB 7, 2019 – June 8, 2020) Zoomed Out

Recommended by Mahmoud Alkudsi
Traits of Successful Traders
Litecoin PRICE DAILY CHART (March 12 – June 8, 2020) Zoomed In
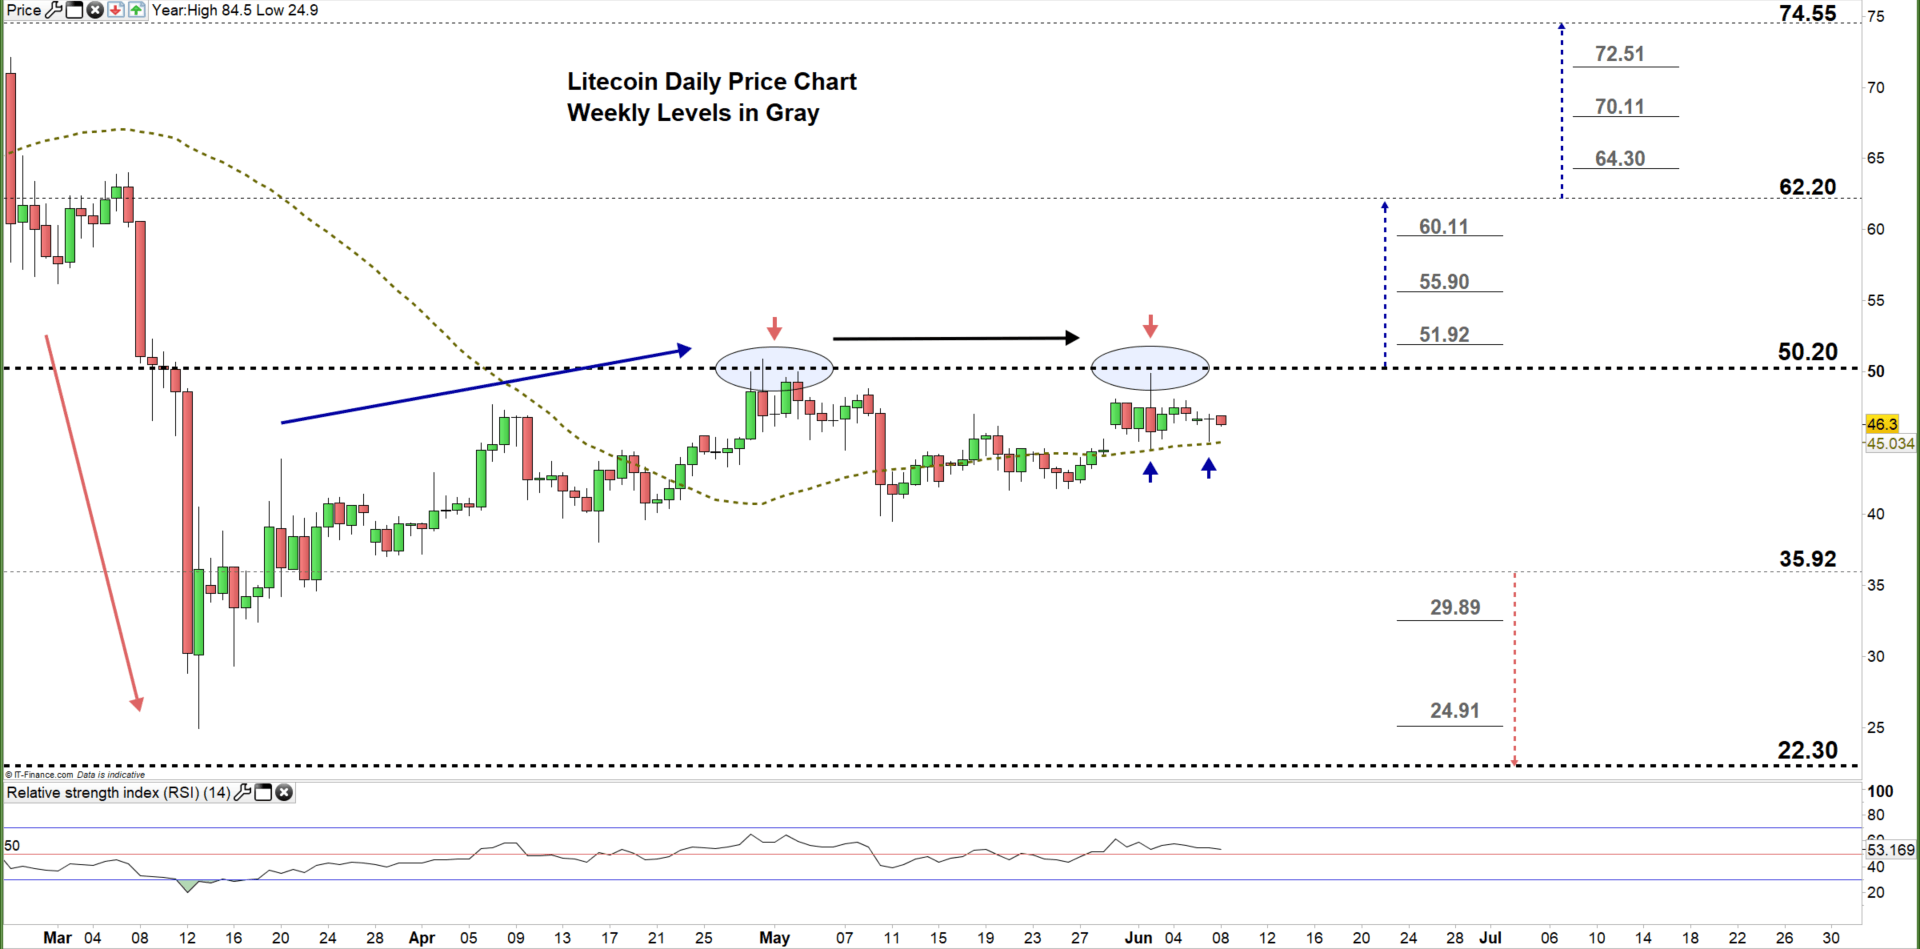
In late April, Litecoin failed to rally to the higher trading zone signaling that bulls were losing momentum. Later on, the price traded in a sideways move creating a set of lower highs with higher lows. Last week, the price rebounded around the high end of the current trading zone $35.92- $50.20 yet remained above the 50-day moving average,indicating that bulls may retake the initiative.
Hence, any successful close above the high end of the aforementioned trading zone may trigger a rally towards $60.20, and a further close above that level may extend the rally towards $74.55.
On the flip-side, any close below the 50-DMA signals that LTC/USD could fall towards the low end of the zone, and a further close below that level may send the price even lower towards $22.30.
That said, the daily and weekly support and resistance levels marked on the daily chart should be kept in focus in both scenarios.

Recommended by Mahmoud Alkudsi
Building Confidence in Trading
Litecoin PRICE FOUR Hour CHART (April 21 – June 8, 2020)
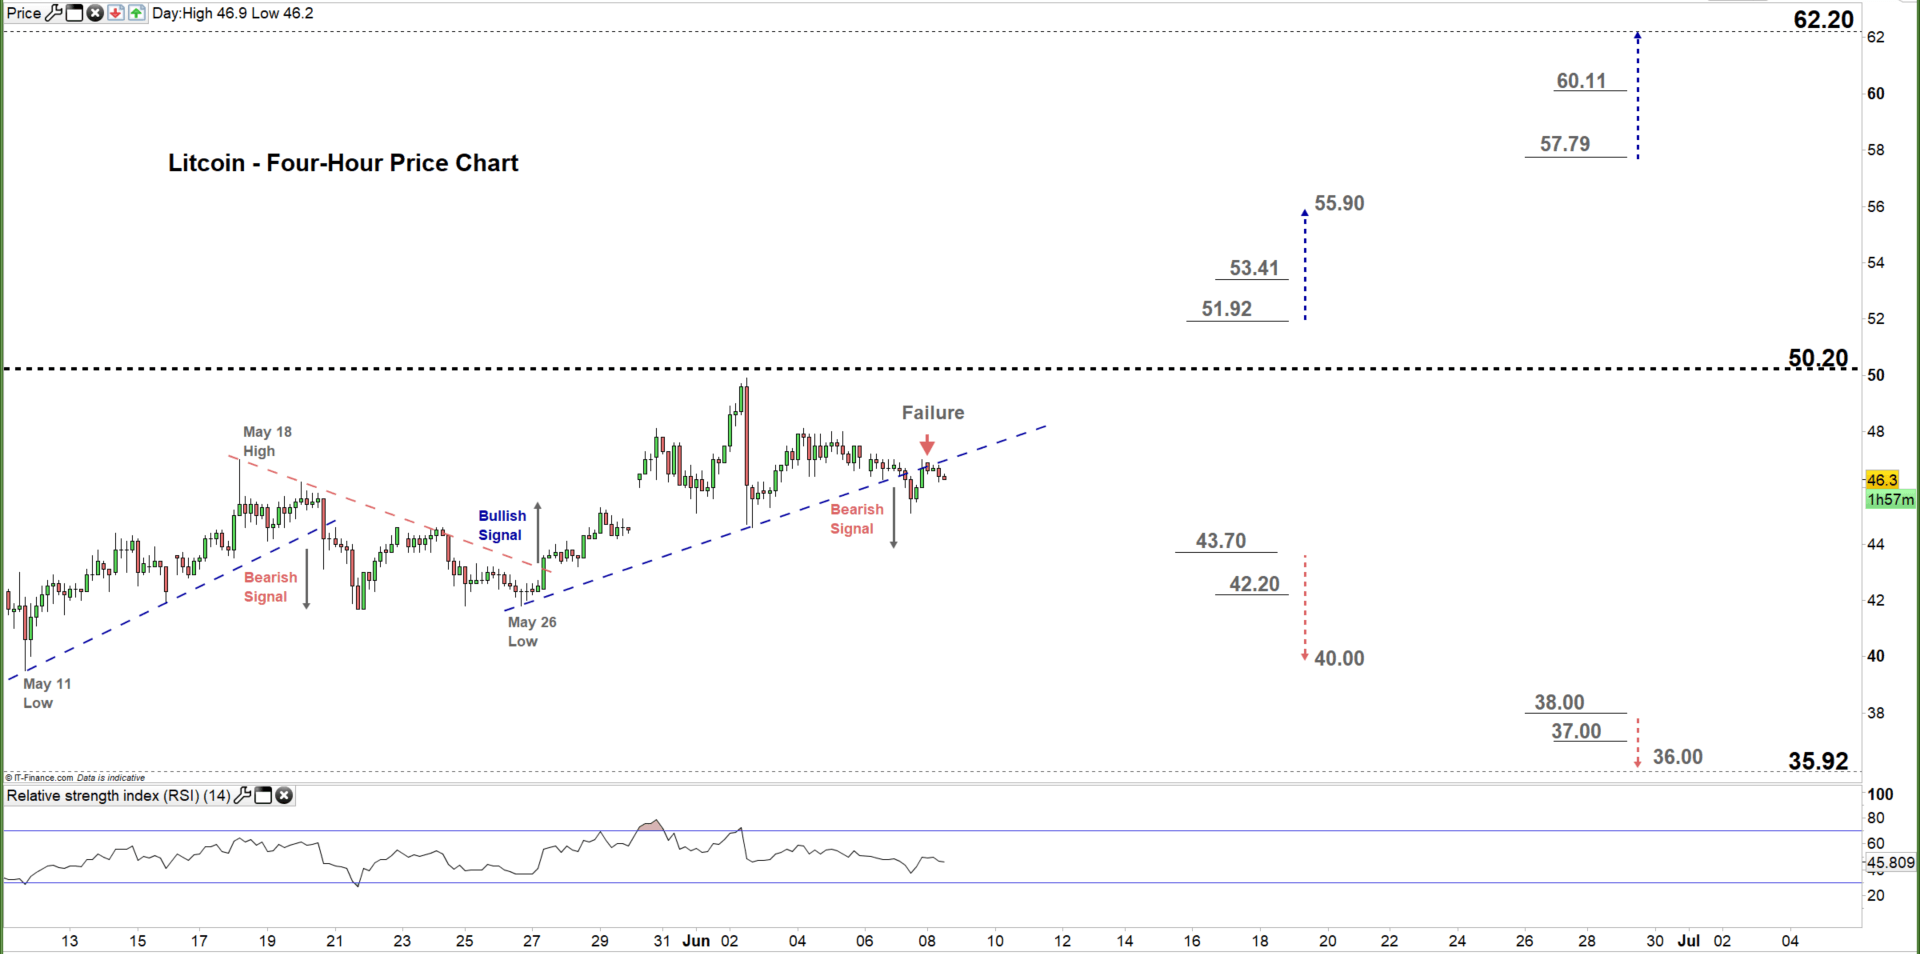
On May 27, the price broke above the downtrend line originated from the May 18 high at $47.00 and generated a bullish signal. Yesterday, the market broke below the uptrend line originated from the May 26 low at 41.8 then remained below this line producing a bearish signal.
Thus, a break below $43.70 could send LTC/USD towards the $40.00 handle. On the other hand, any break above $51.92 may cause a rally towards $55.90. Nonetheless, the daily support and resistance levels underlined on the four-hour chart should be watched closely.

Recommended by Mahmoud Alkudsi
Improve your trading with IG Client Sentiment Data
Written By: Mahmoud Alkudsi,Market Analyst
Please feel free to contact me on Twitter: @Malkudsi