
Litecoin’s overall technicals have remained bearish despite multiple upward swings and have reverted to its previously breached points. It was trading close to the $50 psychological level following the latest surge that catapulted the coin.
Litecoin 12-Hour Chart:
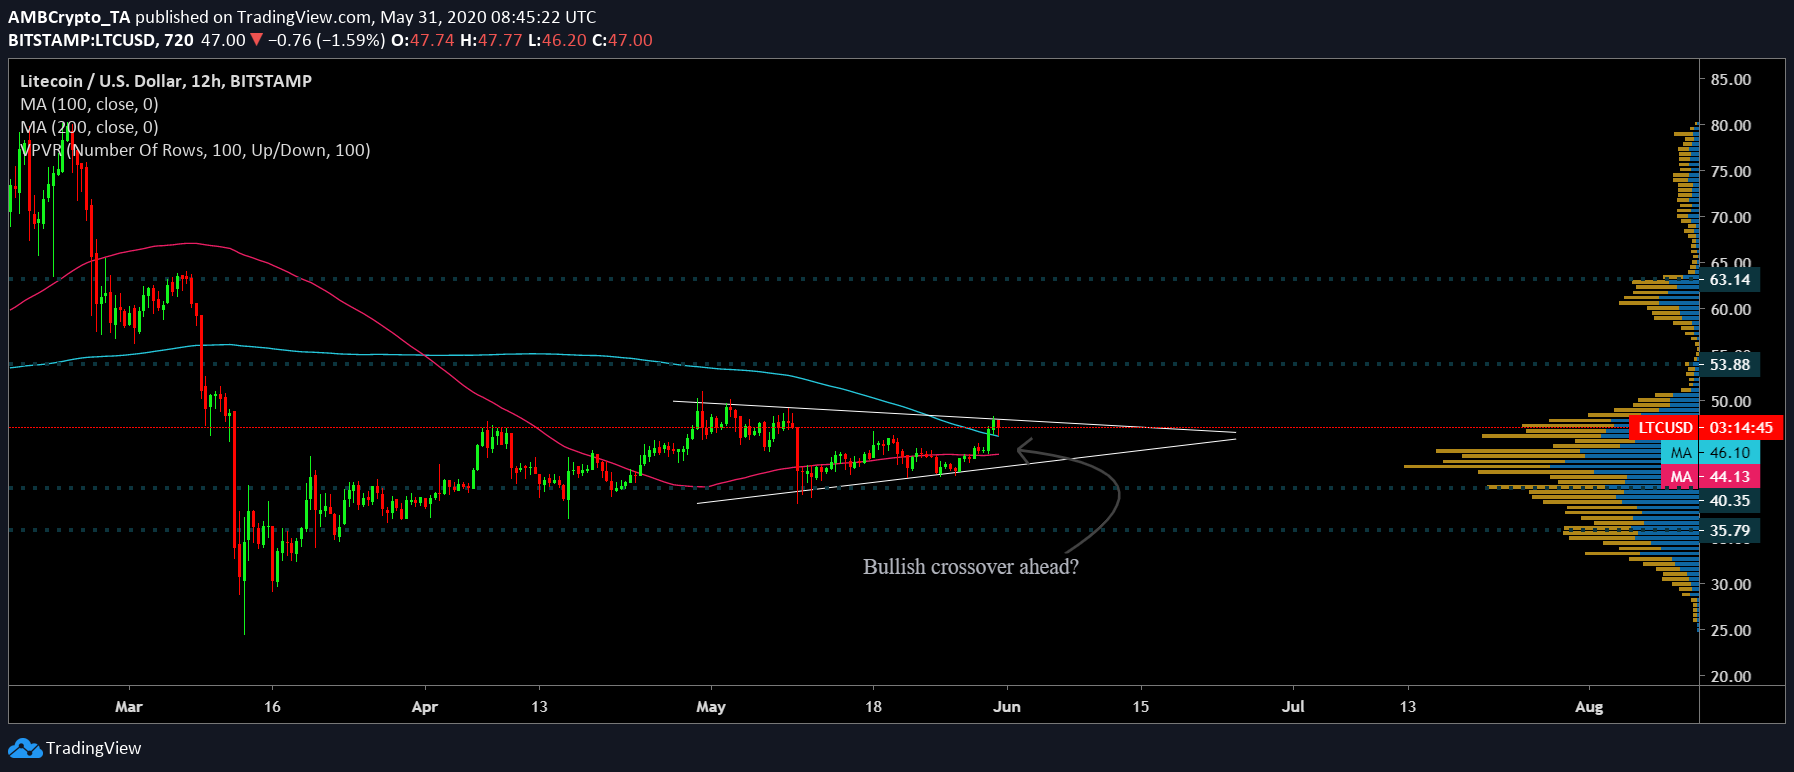
Source: LTC/USD on TradingView
The formation of a symmetrical triangle pattern on the 12-hour Litecoin chart was indicative of a potential breakout that could go either way. After a crash, 50 daily moving average [Pink] and 100 daily moving average [Blue] sustained a bearish crossover in April. However, following consequent surges, the two DMAs started converging and were observed to be treading close. This indicated that a potential bullish crossover could be in the inkling.
In addition, both 50 and 100 DMA slid above the Litecoin candles. This further validated the bullish presence.
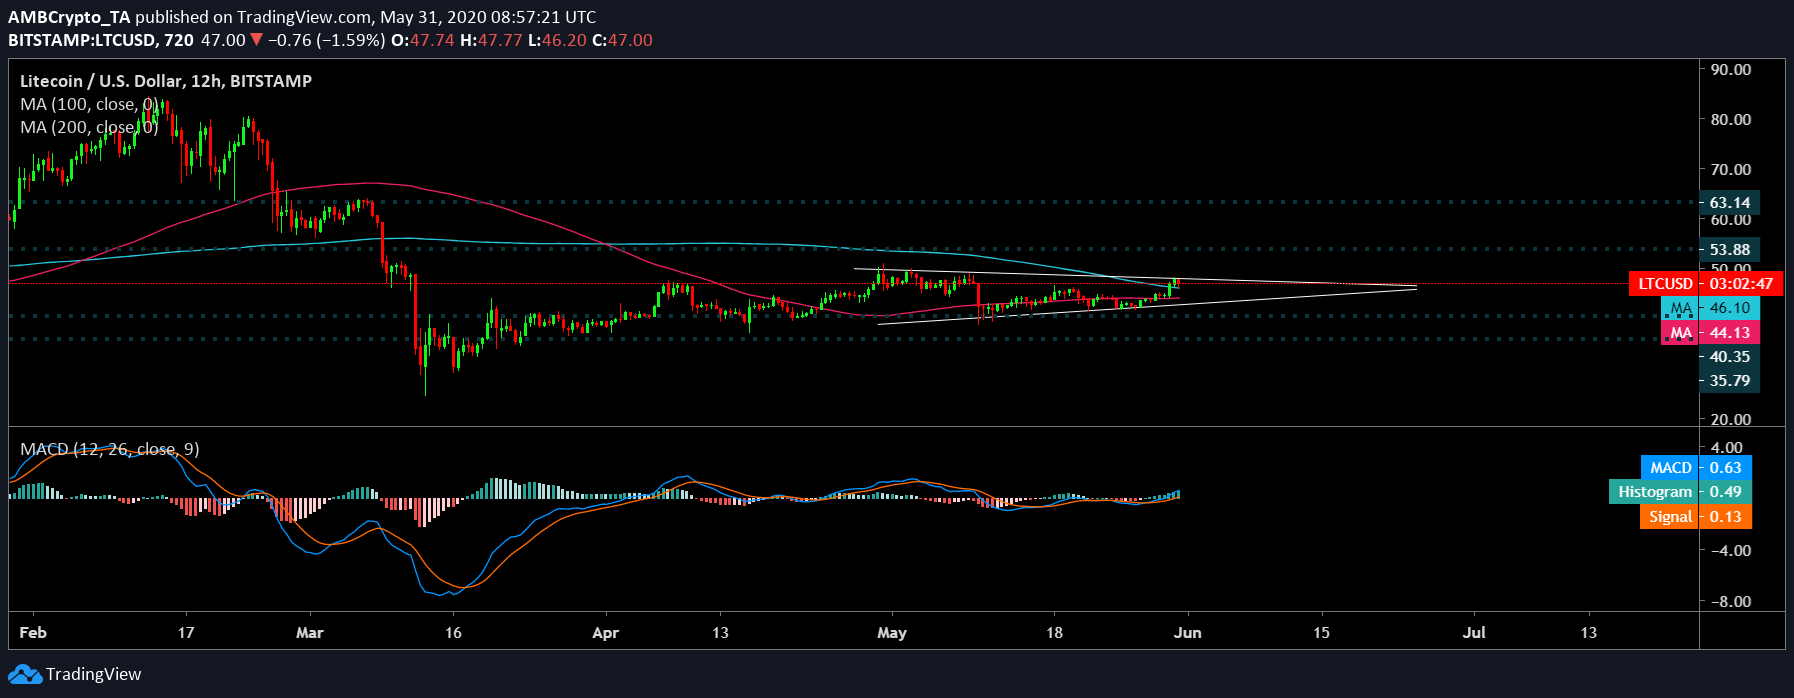
Source: LTC/USD on TradingView
MACD was also above the signal line, which indicated a bullish phase for the silver crypto.
Scenario 1:
A bullish breakout in the near term was supported by the daily moving averages below the price candles. In this case, the coin could climb to key resistances at $53.88 and $63.14, points that were depicted to have high trading activity by the VPVR indicator.
Scenario 2:
A bearish breakout is highly unlikely as the coin found critical support at $40.35 and $35.79 as depicted by the VPVR indicator.
Correlation:
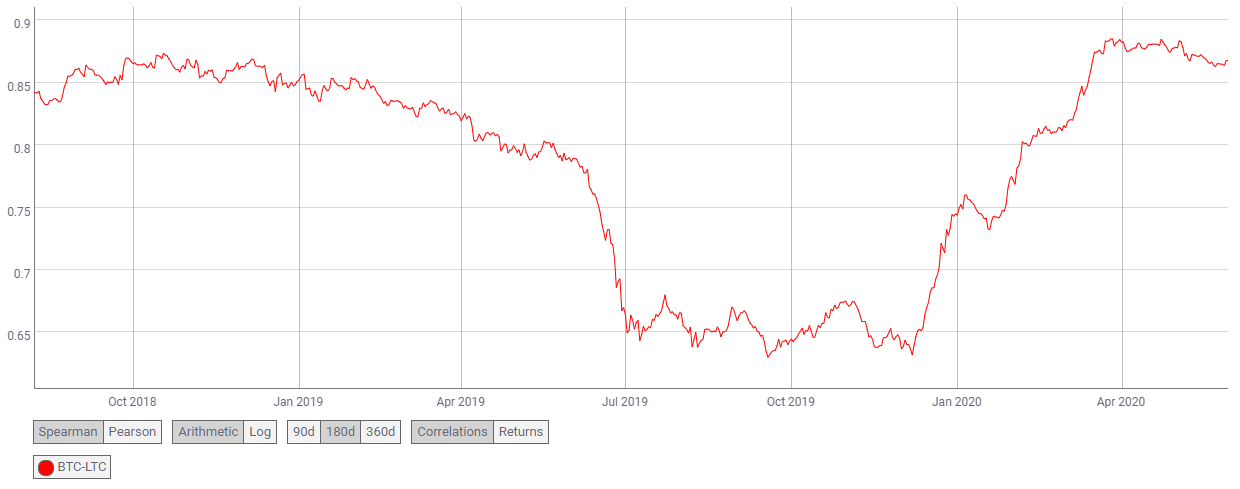
Source: Coin Metrics
Litecoin is the silver to Bitcoin and has historically been responsive to the king coin’s price action. Currently, BTC-LTC correlation coefficient stood at 0.86. Bitcoin’s rally will be able to drive Litecoin’s up to climb significant points that have acted as resistance for quite some time.
Conclusion:
Litecoin’s potential breakout on the upside could help reclaim resistance points at $53.88 and $63.14. The price candles were firmly supported at points $40.35 and $35.79.
Your feedback is important to us!