
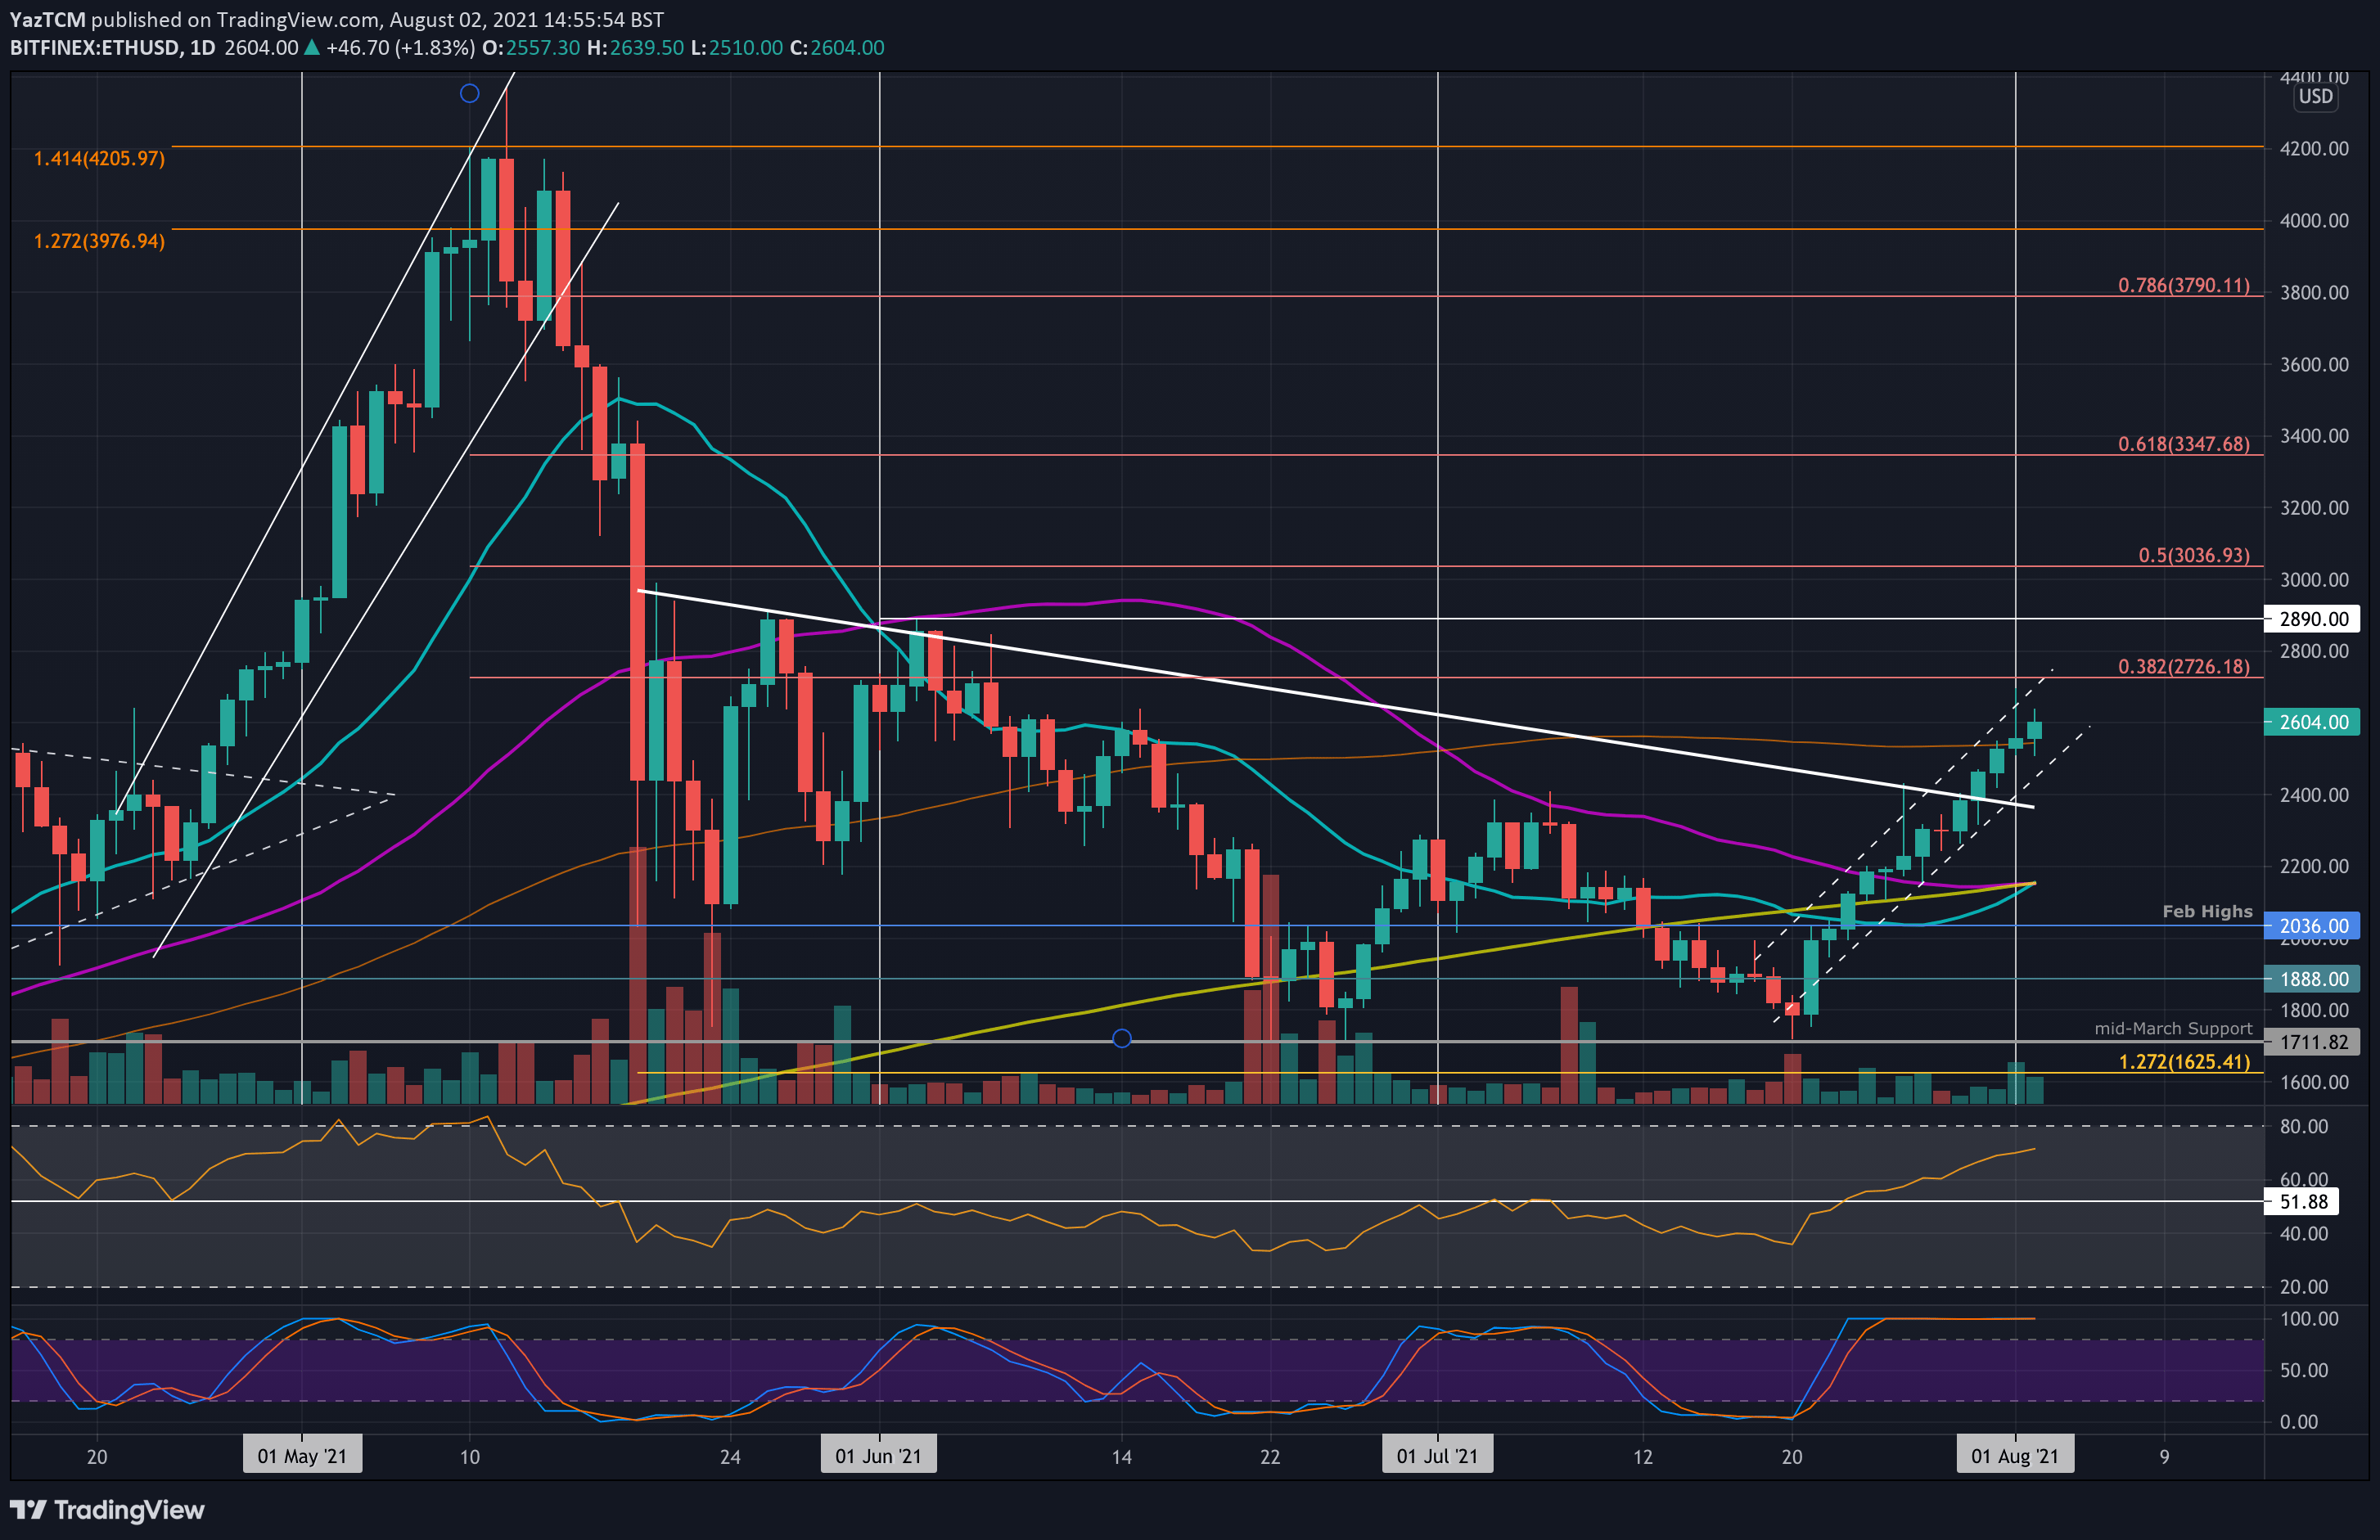
ETH/USD – Ether Hits $2600 After Breaking 100-day MA
Key Support Levels: $2545, $2400, $2320.
Key Resistance Levels: $2725, $2890, $3000.
Etheruem saw an incredible 18% surge this week as it climbs inside the confines of an ascending price channel. The cryptocurrency broke above a descending trend line toward the end of last week and pushed above the 100-day MA level yesterday to hit $2600 today.
ETH did surge as high as $2700 yesterday, allowing the coin to set a new high not seen since the first week of June.
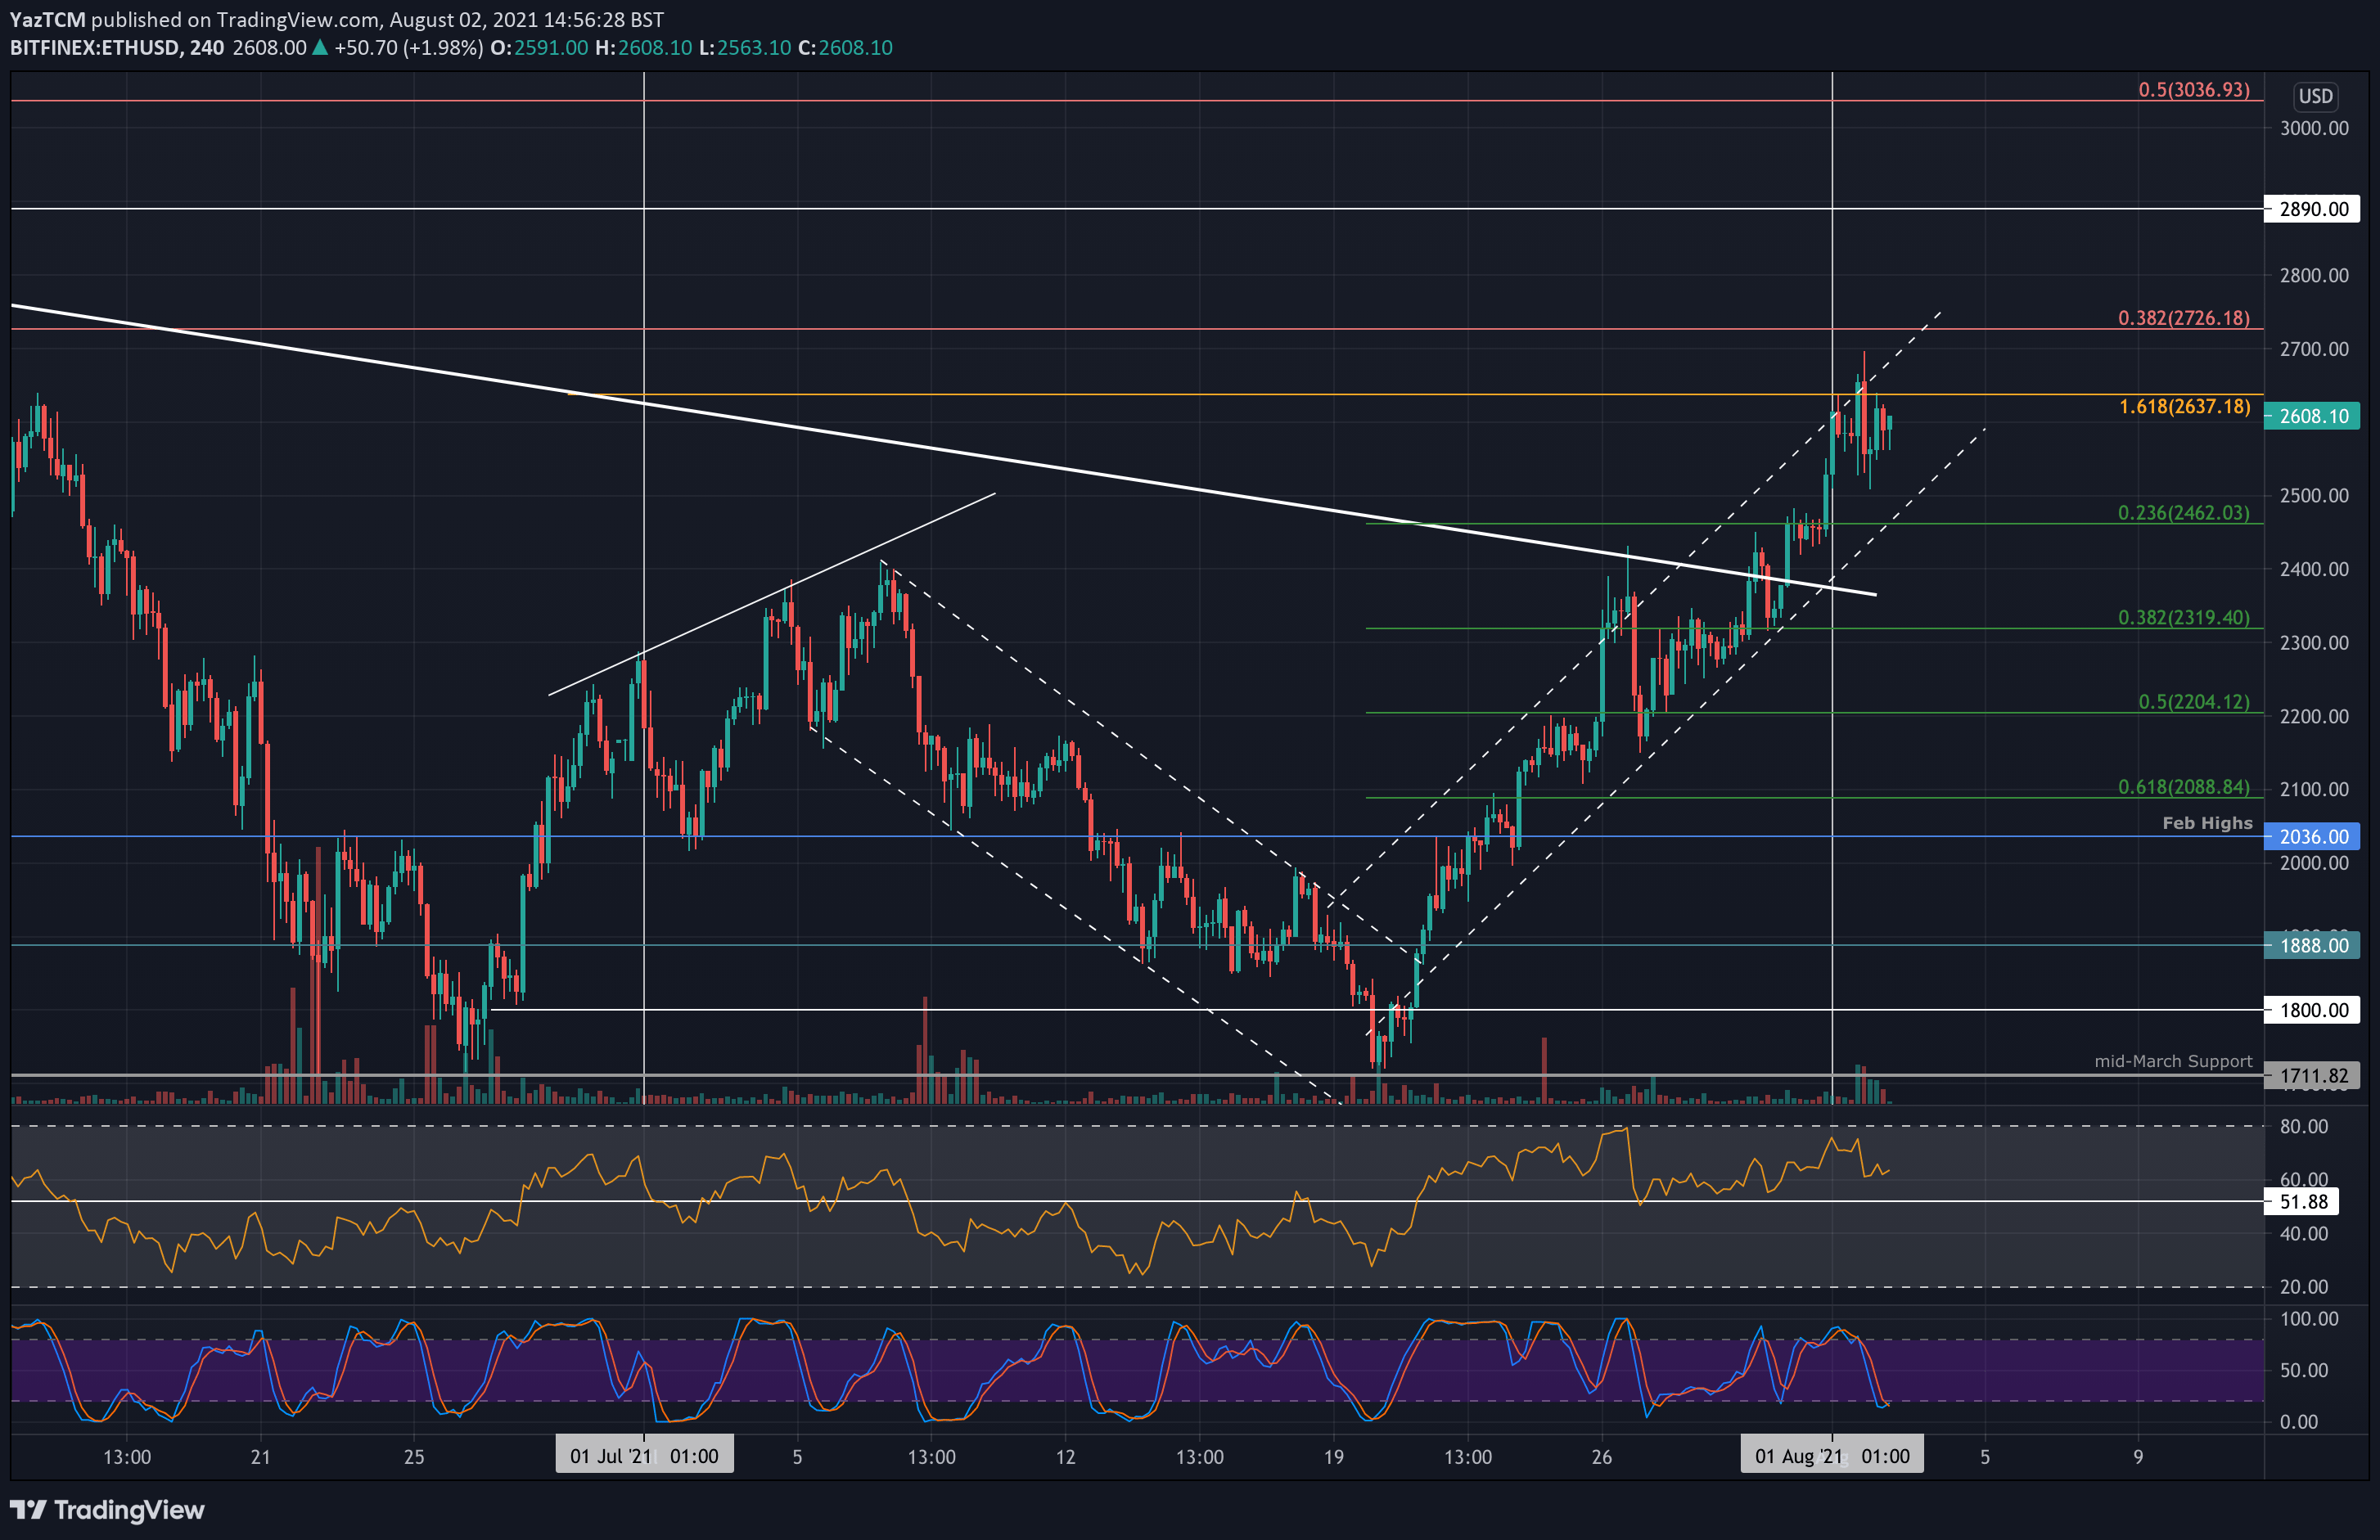
The 4-hour chart shows the ascending price channel more clearly. It is a steep price channel, and a breakout toward the upside of this channel would turn ETH parabolic ahead of the London hard fork upgrade.
ETH-USD Short Term Price Prediction
Looking ahead, the first resistance lies at $2725 (bearish .382 Fib). This is followed by $2890 (June highs), $3000, and $3035 (bearish .5 Fib).
On the other side, the first support lies at $2545 (100-day MA). This is followed by $2400, $2320 (.382 Fib), and $2200 (.5 Fib).
The 4-hour RSI is showing hints of bearish divergence, but the daily RSI indicates that the market is still not yet overbought.
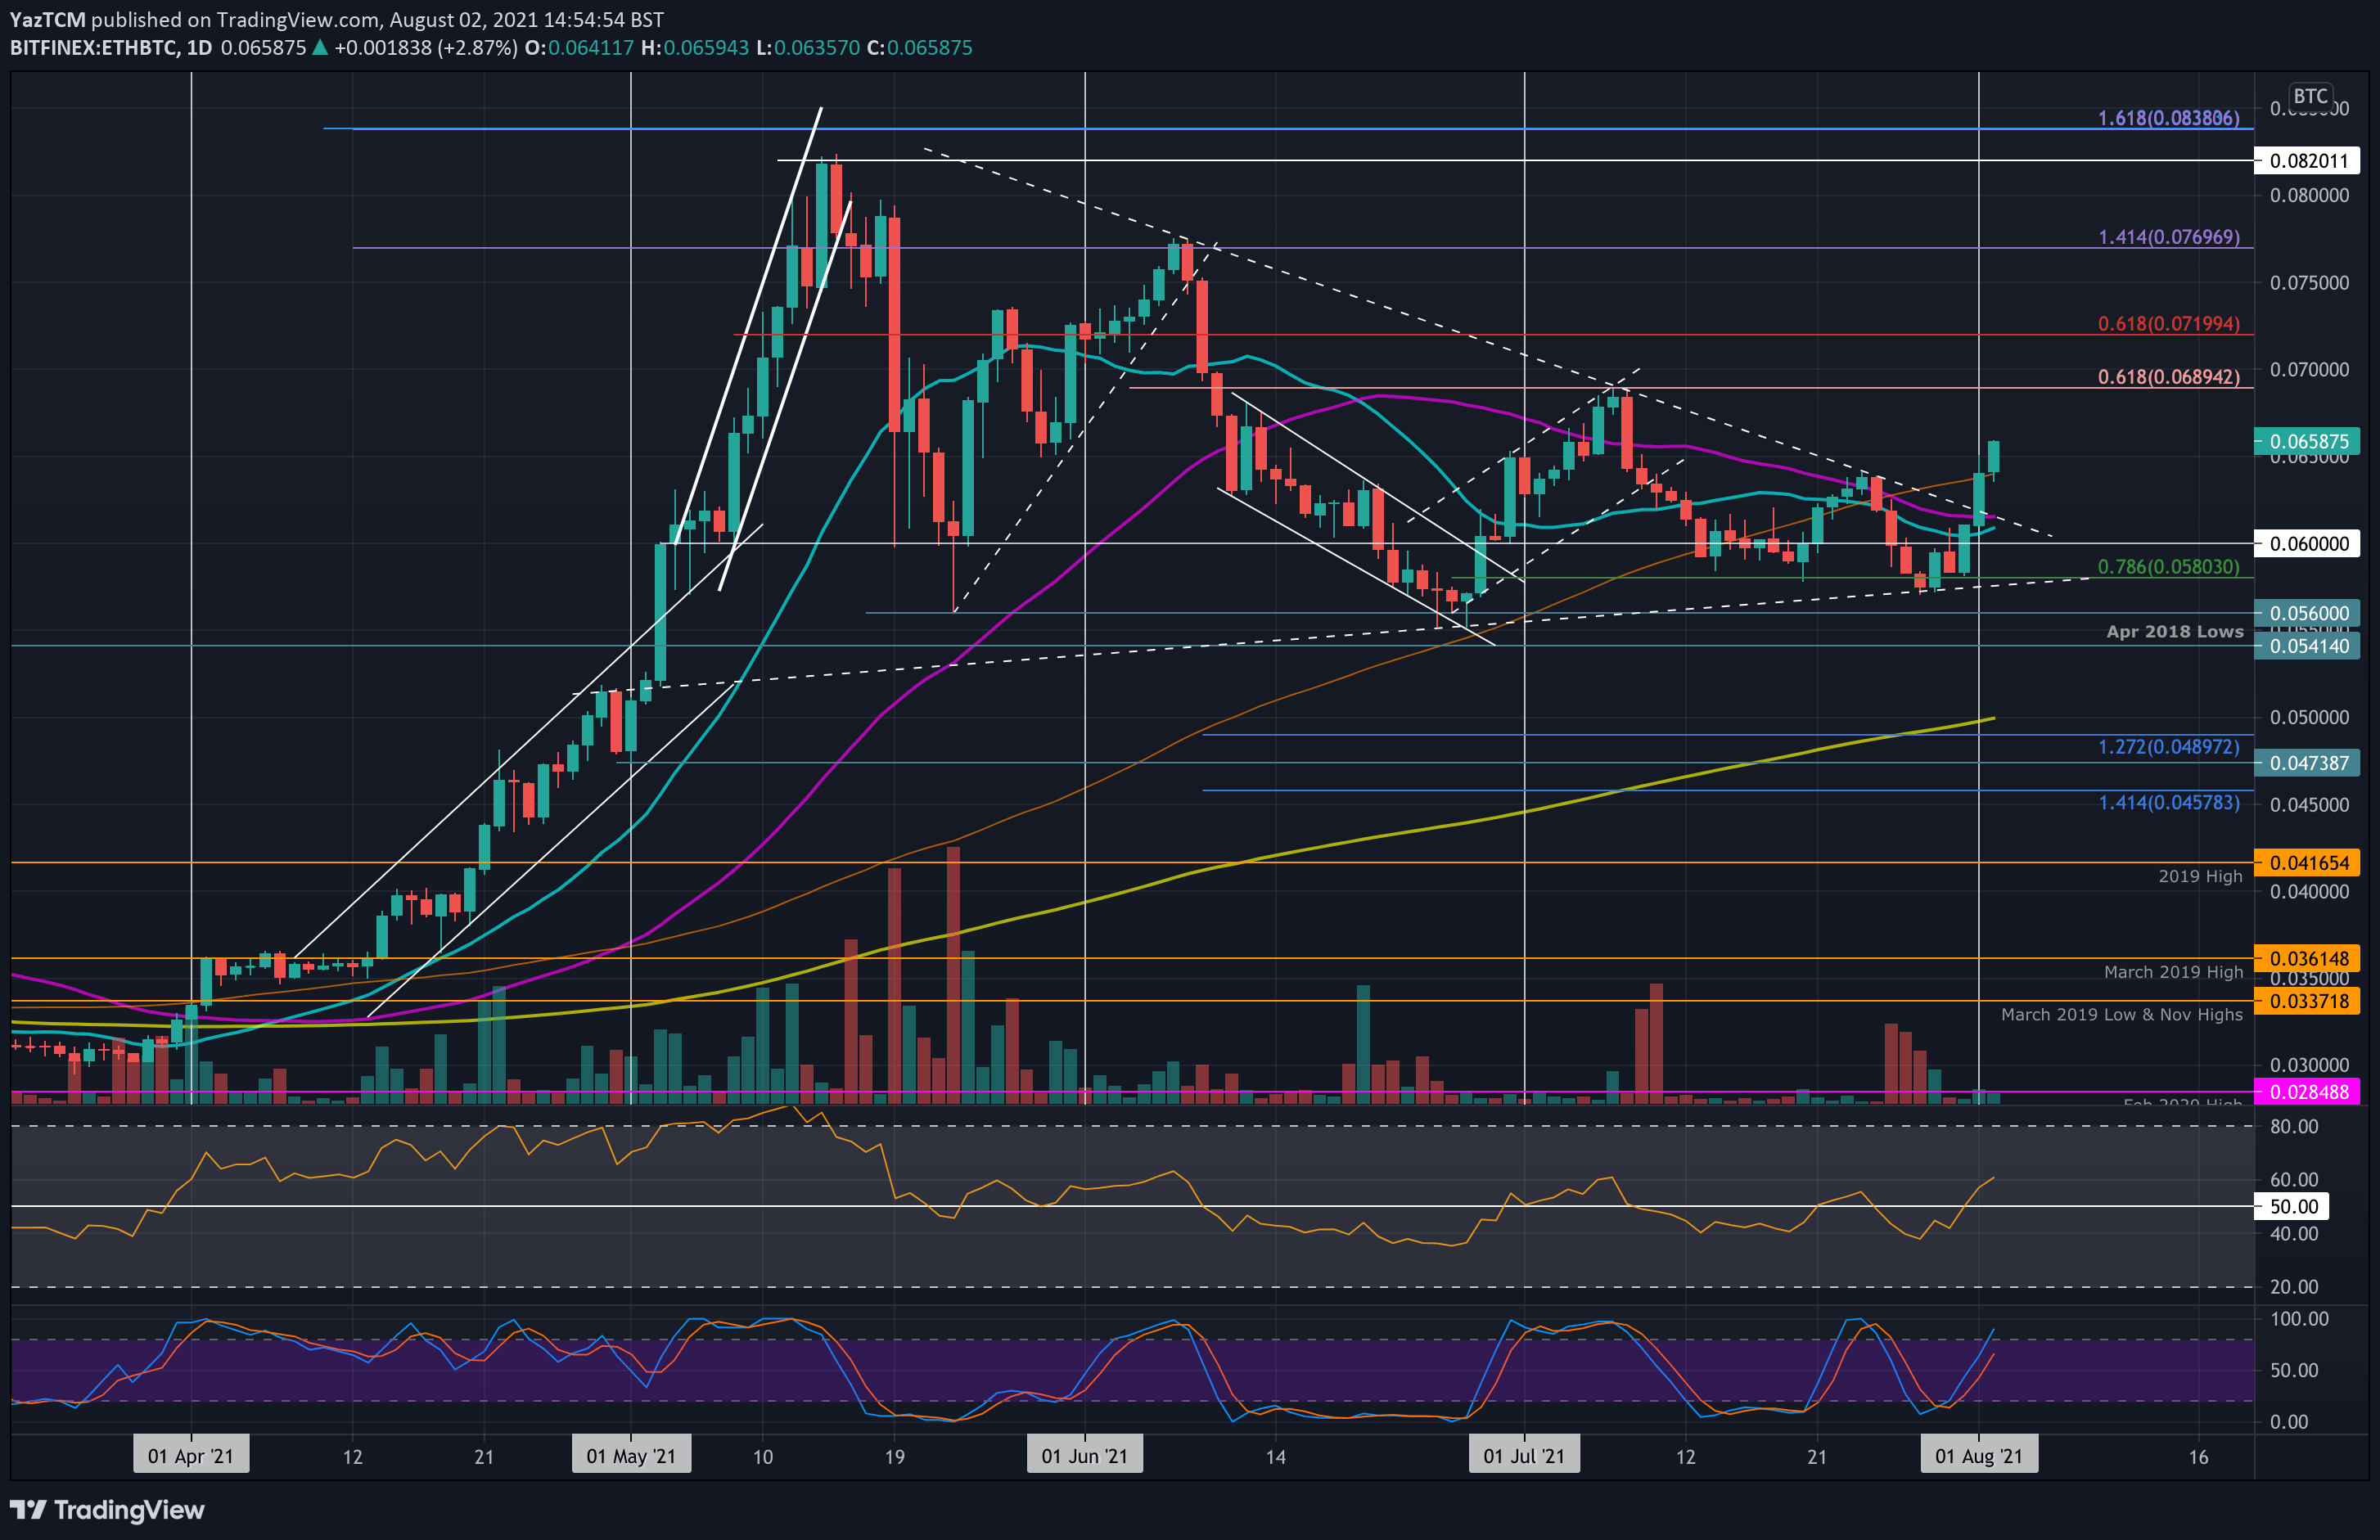
ETH/BTC – ETH Penetrated Symmetrical Triangle Pattern
Key Support Levels: 0.064 BTC, 0.061 BTC, 0.06 BTC.
Key Resistance Levels: 0.069 BTC, 0.072 BTC, 0.075 BTC.
Against BTC, ETH finally broke above the consolidation pattern that it was trapped within since the start of June. The coin found support at the lower boundary of the triangle toward the end of last week and surged above it yesterday.
As it broke the triangle, ETH also broke resistance at the 50-day MA and the 100-day MA today to climb to 0.0658 BTC and point toward the July highs.
ETH-BTC Short Term Price Prediction
Moving forward, the first resistance lies at 0.069 BTC (bearish .618 Fib). This is followed by 0.072 BTC (long term bearish .618 Fib), 0.075 BTC, and 0.077 BTC (June highs).
On the other side, the first support lies at 0.064 BTC (100-day MA). This is followed by 0.061 BTC (50-day MA), 0.06 BTC, and 0.058 BTC (.786 Fib).
The RSI is rising inside the bullish territory, indicating the bullish momentum is increasing.
Binance Futures 50 USDT FREE Voucher: Use this link to register & get 10% off fees and 50 USDT when trading 500 USDT (limited offer).
PrimeXBT Special Offer: Use this link to register & enter POTATO50 code to get 50% free bonus on any deposit up to 1 BTC.
Disclaimer: Information found on CryptoPotato is those of writers quoted. It does not represent the opinions of CryptoPotato on whether to buy, sell, or hold any investments. You are advised to conduct your own research before making any investment decisions. Use provided information at your own risk. See Disclaimer for more information.
Cryptocurrency charts by TradingView.