
- Bitcoin price might drop lower if it cannot sustain the recent sweep above a critical resistance level at $36,735.
- Ethereum price is also facing a supply zone that extends from $2,689 to $2,843 and hints at a decline.
- XRP price faces a confluence of resistance levels and hints at a 10% decline to $0.985.
Bitcoin price is grappling with a stiff resistance level and could head lower if the buyers fail to hold above it. Although ETH and XRP might show promise, they will follow BTC if things go south.
Bitcoin price tiptoes after slicing through a barrier
Bitcoin price recently breached a resistance level at $36,735 and is currently trading above it. However, a failure to stay above it might lead to a downswing toward this week’s open at $35,669 or the previous week’s opening price of $34,758.
If the selling pressure breaks through both of the crucial support barriers, the buyers will likely step in after a brief dip into the demand zone, extending from $31,111 to $34,000.
Investors can expect a retracement that could stretch up to 7% before an upswing narrative evolves.
A dip into the said demand area might replenish the buying pressure, opening up the possibility for a quick 20% rally to the recent swing high at $40,900. Following a breach of this level, Bitcoin price might rise to $41,986 if the buying pressure persists. This point is the local top created in early January that coincides with the right shoulder’s peak.
BTC/USD 6-hour chart
If this pullback produces a 6-hour candlestick close below $31,111, it would invalidate the bullish outlook and trigger a downswing below it. However, the chances of this scenario occurring are slim to none.
Ethereum price follows the flagship cryptocurrency
Like Bitcoin, Ethereum price is currently facing a supply zone extending from $2,689 to $2,843. A rejection at this level will push ETH down to the weekly open at $2,383, which is an 11% downswing. If the buyers fail to defend this level, Ether will slide to the immediate support at $2,101, which coincides with the previous week’s opening price.
Investors can expect a reversal here that could push the smart contract token up by 25% to the supply zone’s lower trend line at $2,689.
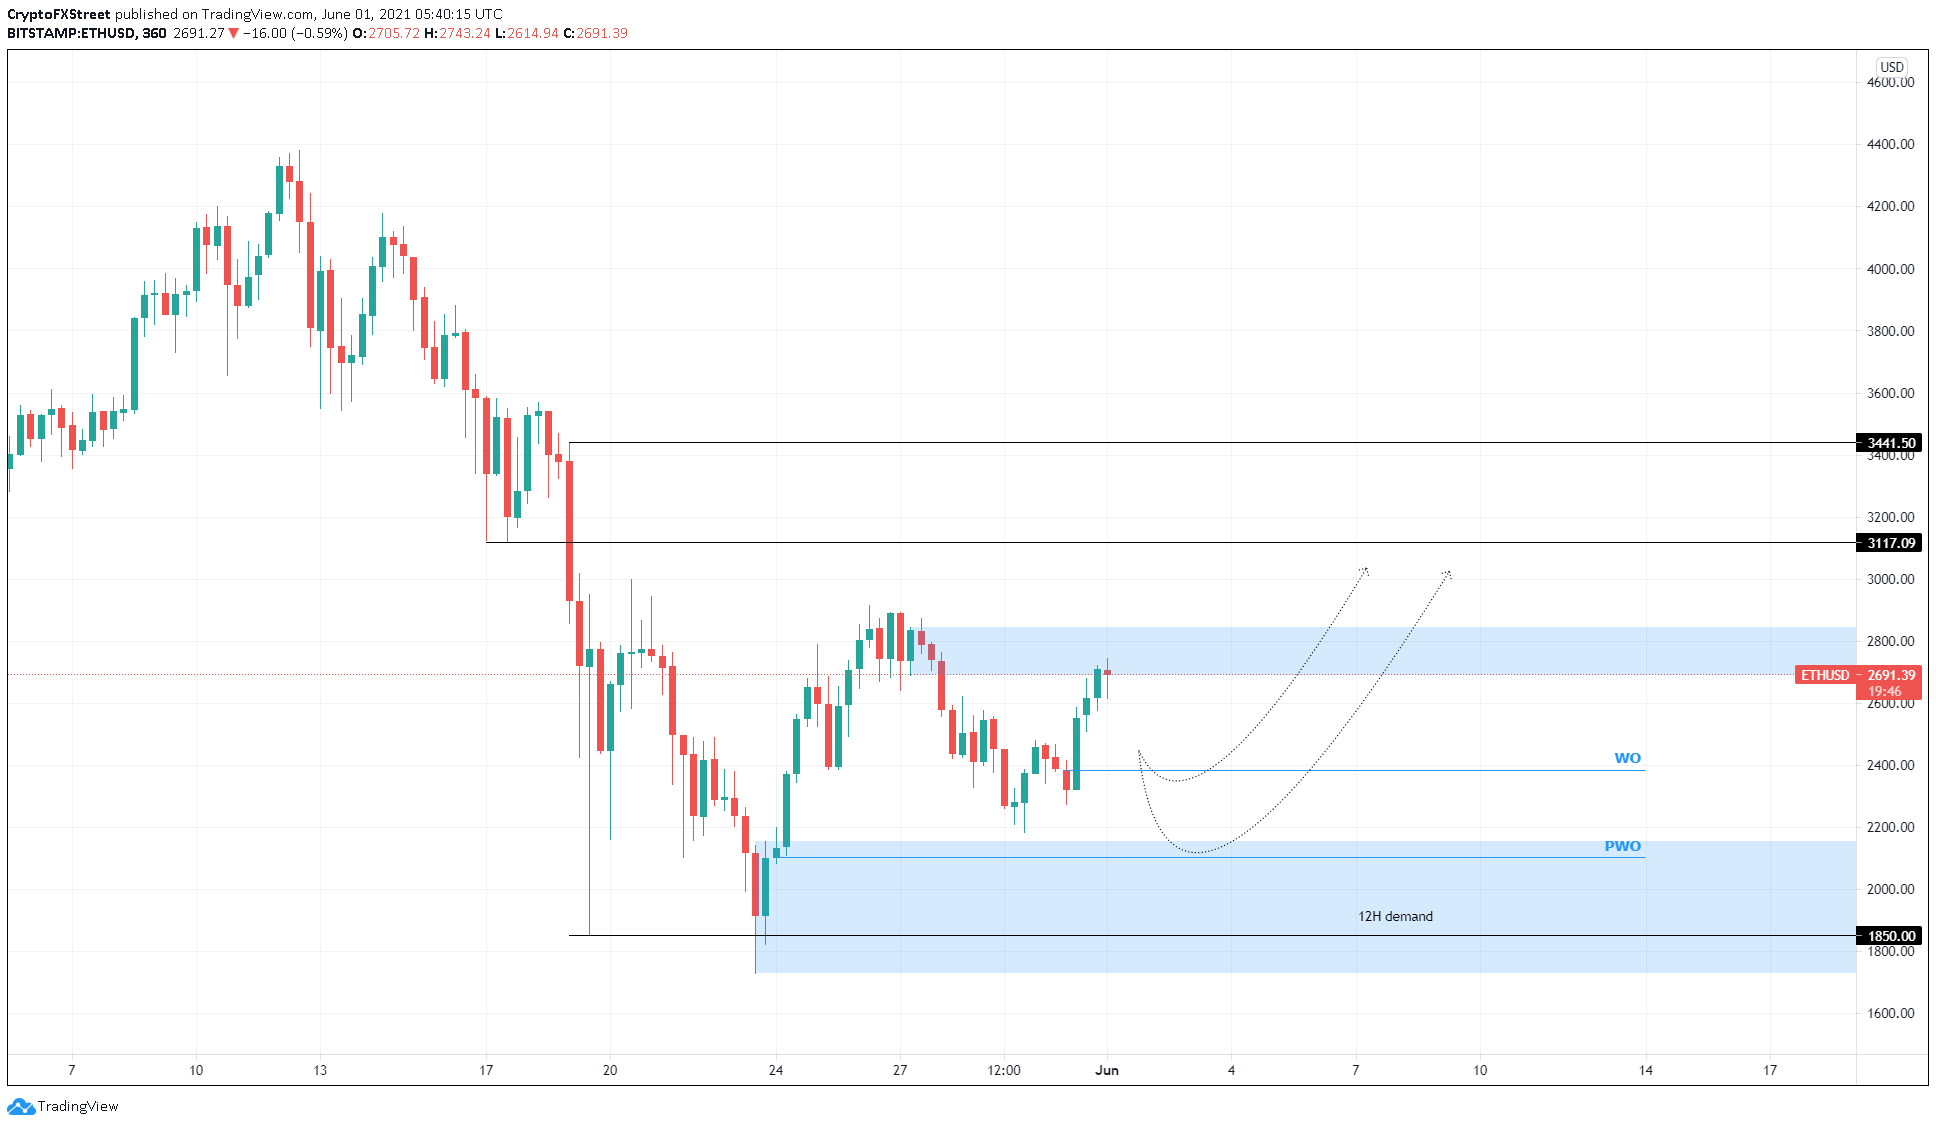
ETH/USD 6-hour chart
However, if the May 19 swing low at $1,850 is breached, it would invalidate the short-term bullish outlook and trigger a consolidation for Ethereum price. Under these conditions, ETH could slide to the immediate support level at $1,730.
Ripple price stuck between two barriers
Ripple price is currently tussling with the 100 four-hour Simple Moving Average (SMA) at $1.094, which coincides with the supply zone’s lower limit. Therefore, investors can expect a minor 10% pullback into the demand zone, stretching from $0.948 to $0.985. Interestingly the 50 four-hour SMA at $0.942 is present extremely close to the level mentioned above.
Therefore, a pullback will mostly face extinction here, allowing buyers to kick-start a move higher.
This attempt will most likely push XRP price to the 100 four-hour SMA at $1.094. A successful breach of this level will allow the buyers to conquer the supply zone.
Only a decisive close above $1.183 will confirm a breakout. Such a move will allow the bulls to carry the remittance token to retest the 200 four-hour SMA at $1.293.
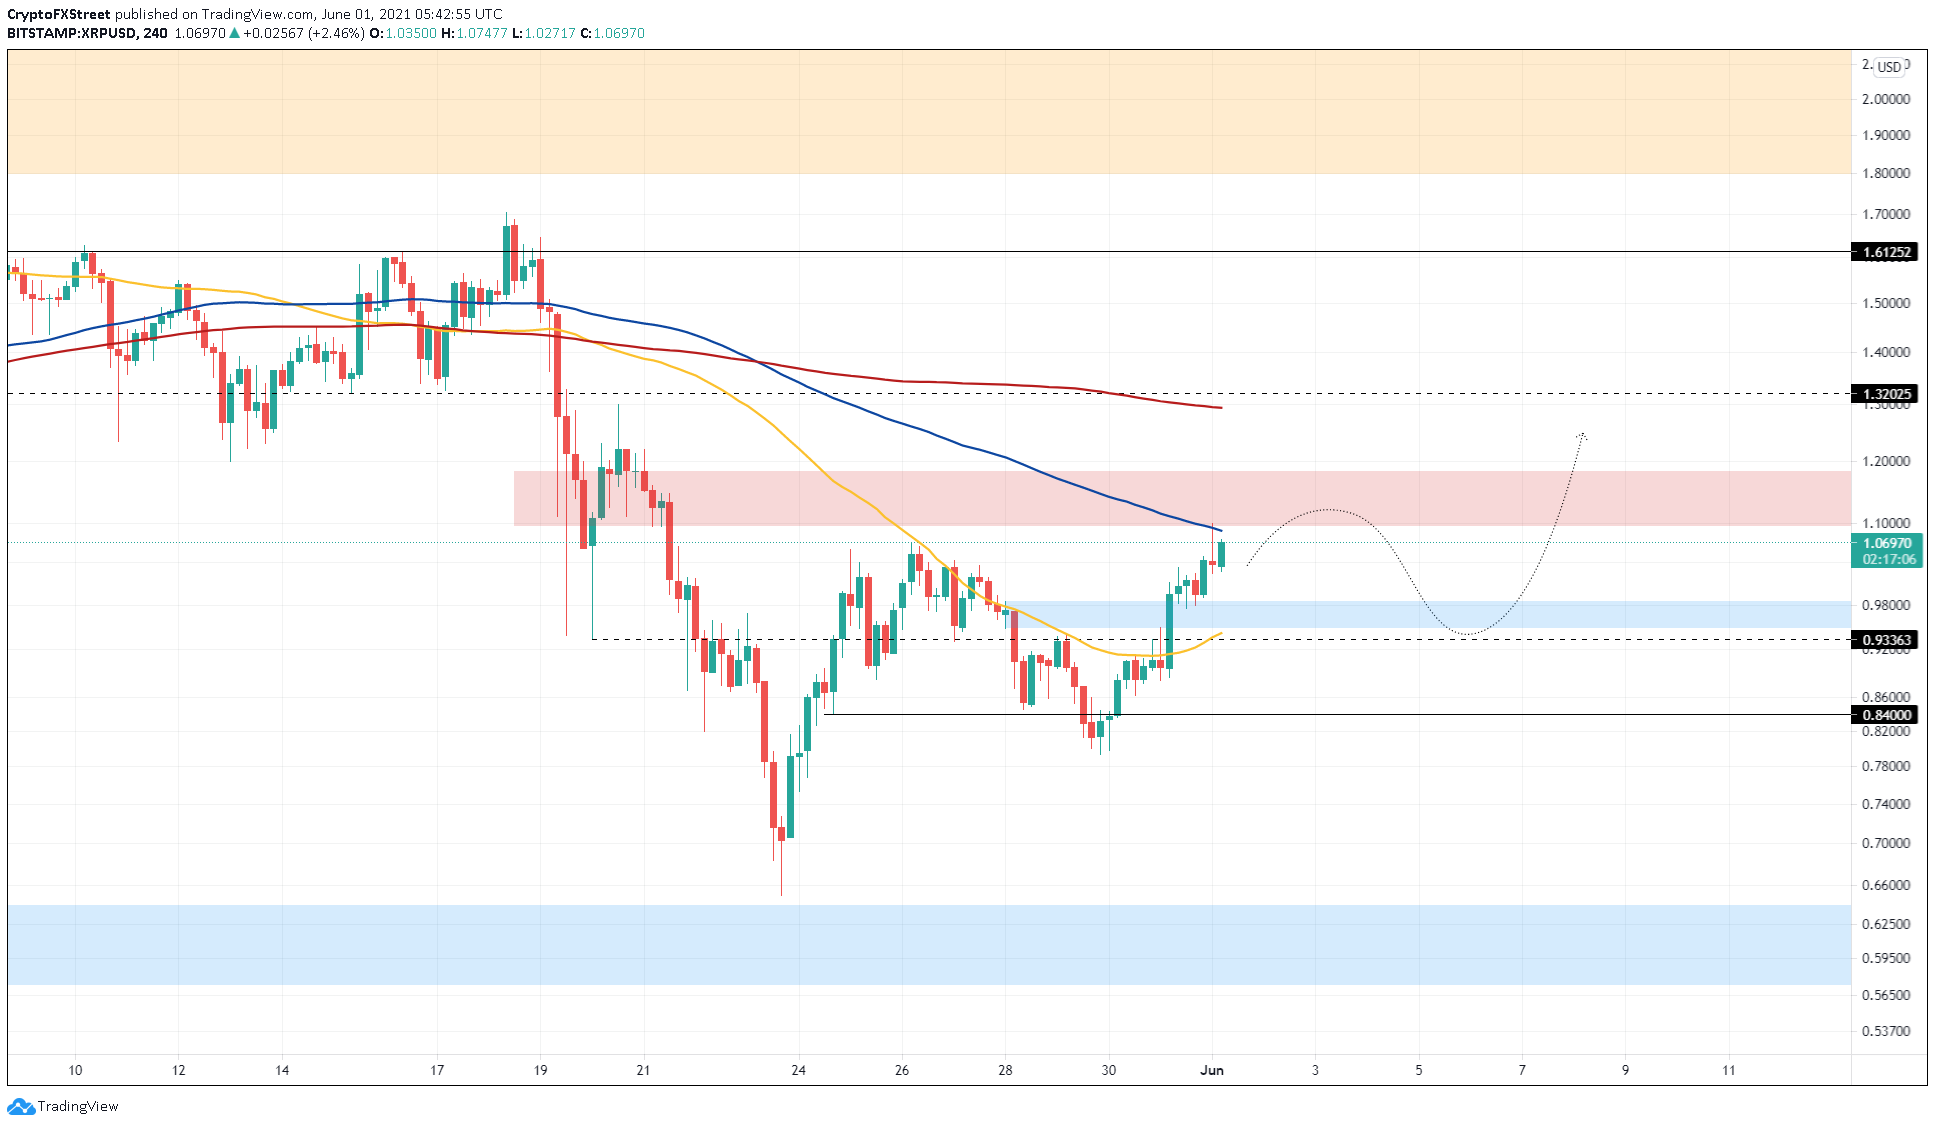
XRP/USD 4-hour chart
On the flip side, if XRP price fails to hold above $0.934, it will invalidate the optimistic narrative detailed above. This downswing will set the stage for a 9% crash to $0.840.