
- Bitcoin price experiences a steep correction after failing to slice through the $59,545 resistance.
- Ethereum price respected the MRI’s sell signal and retraced 10% from its all-time high.
- XRP price slid below the 50 SMA at $1.426 and eyes a retest of the 200 SMA at $1.16.
The cryptocurrency market experienced a crash as the flagship cryptocurrency tumbled. Although some altcoins are recovering, Bitcoin price is still scrambling to find a support level and might trigger another sell-off soon.
In such a scenario, Ethereum and Ripple might promptly follow.
Bitcoin price remains indecisive
The 6-hour chart shows Bitcoin price has been experiencing trouble moving above $59,545. A rejection at this resistance wall has led to a 10% drop. The current recovery shows the absence of a stable support barrier, leading to a fake run-up, followed by a drop to $50,931.
Bitcoin price found multiple bid orders lined up here during the April 18 crash, which led to a quick upswing. Therefore, it is likely that the pioneer cryptocurrency will tag this level before it reverses.
Under extremely bearish conditions, it could test the demand zone that extends from $46,930 to $49,949.
Although undecided, a bounce from either of the areas mentioned above will lead to a 17% rally to $59,545.
BTC/USDT 6-hour chart
On the flip side, a breakdown of $49,949 will invalidate this bullish outlook and trigger a 4% downswing to $44,850.
Ethereum price eyes a minor downtrend
Ethereum price dropped 12% and is already on the road to recovery after gaining 2% since. However, similar to BTC, ETH might retest the 78.6% Fibonacci retracement level at $3,724 again.
Since BTC is not done dropping yet, investors can expect the altcoin pioneer to follow the flagship cryptocurrency and retest the 61.8% Fibonacci retracement level at $3,565. Interestingly, this point coincides with the 50 six-hour Simple Moving Average (SMA). Hence, an upswing that results from a test of this area will most likely push Ethereum price to retest its recent high at $4,208.
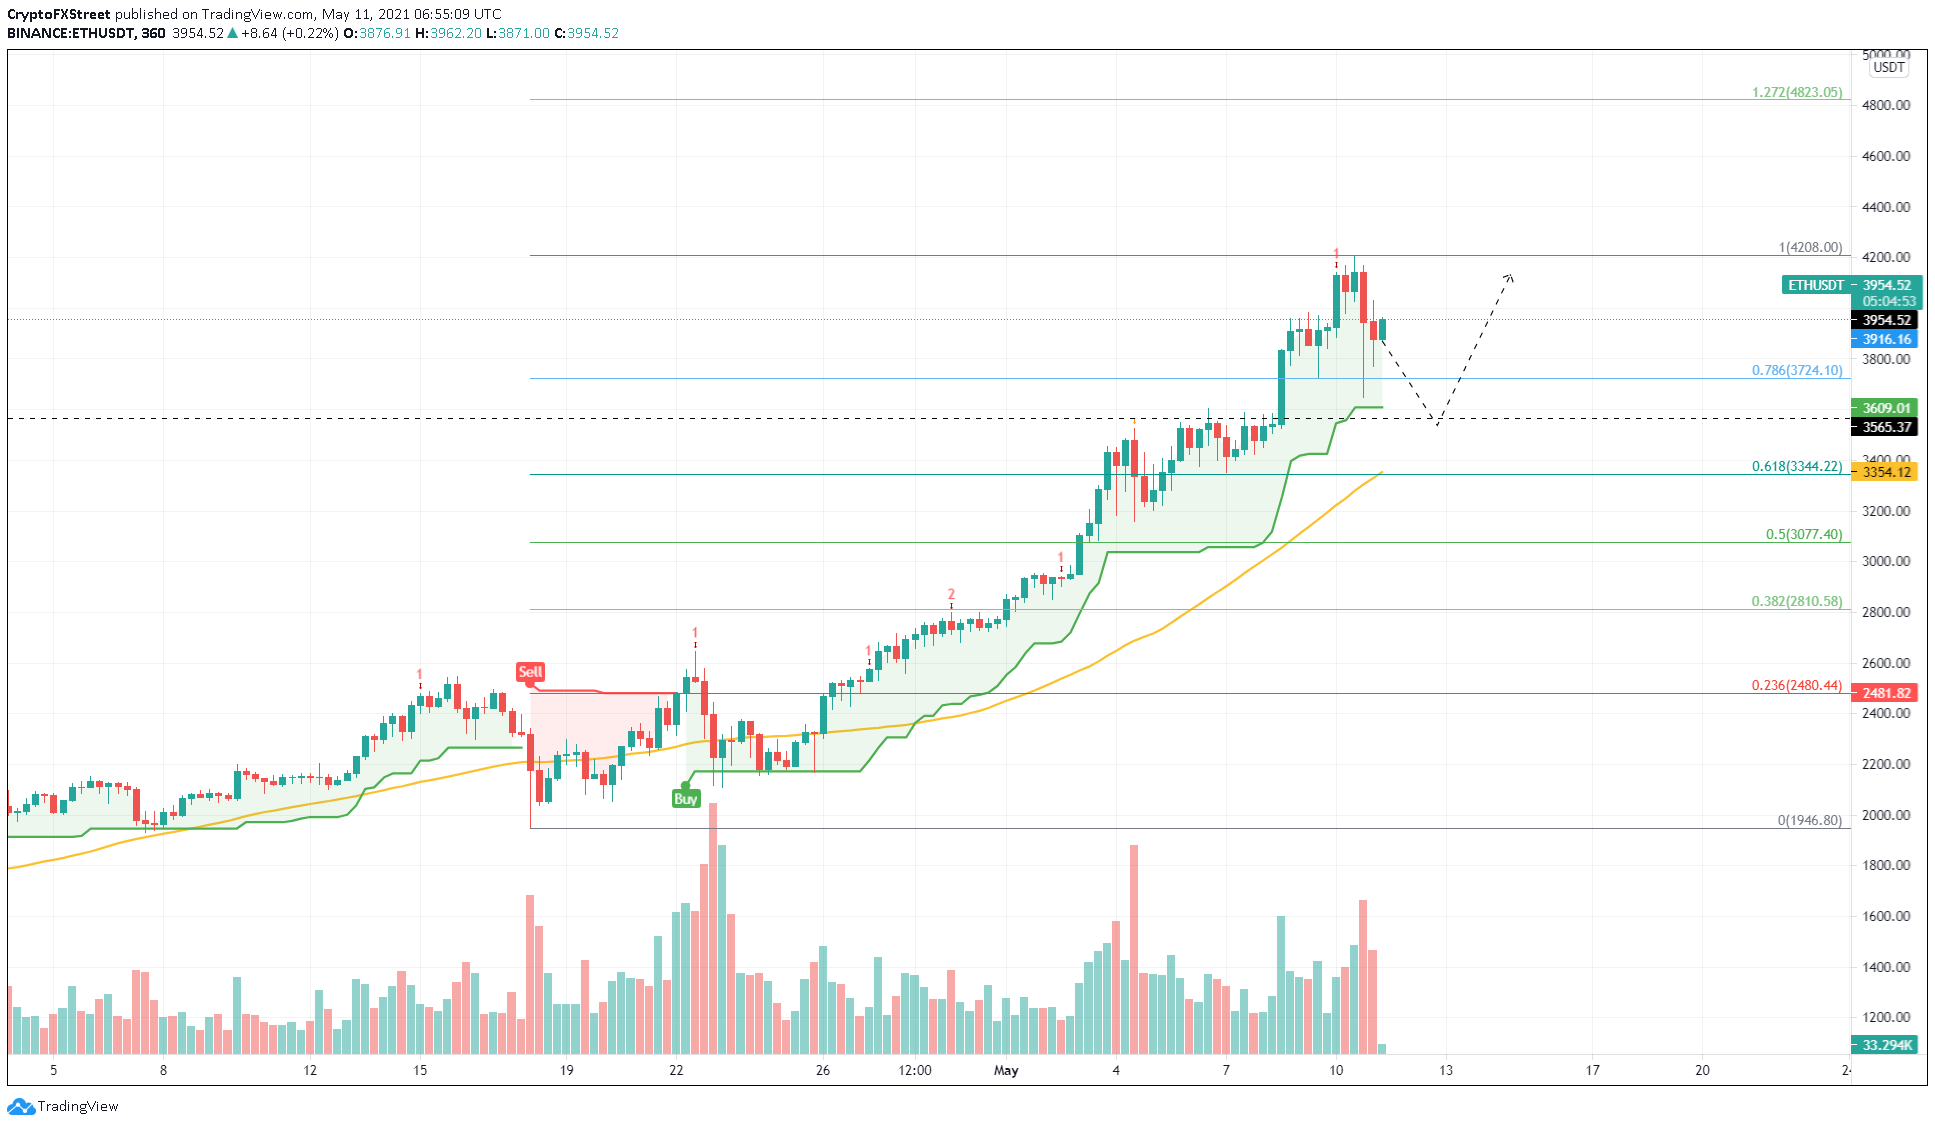
ETH/USDT 6-hour chart
Regardless of the bullish outlook, Ethereum price has seen a massive surge and might be overbought. Therefore, a breakdown of the support at $3,565 will invalidate the short-term bullish outlook and trigger an 8% correction to $3,077.
XRP price starts recovery, but threat of downturn remains
XRP price is currently bouncing off the lower trend line of a demand zone that extends from $1.372 to $1.477.
Although Ripple sliced through this support barrier during the crash, buyers seem to have quickly scooped up the remittance token at a discount. Now, XRP price could surge 15% to test the resistance wall at $1.65, which has successfully put an end to Ripple’s rallies twice over the past week.
Therefore, investors need to exercise caution around this supply level.
A breach of this barrier will open up XRP price to a 7% run-up to the immediate ceiling at $1.769.
While this bullish narrative seems plausible, market participants need to keep a close eye on Bitcoin. As explained above, if BTC takes a nosedive, XRP price will most likely head to the demand zone that extends from $0.941 to $1.156.
After taking a brief stroll in this area, an upswing might attract more sidelined buyers and propel XRP to the levels mentioned above.
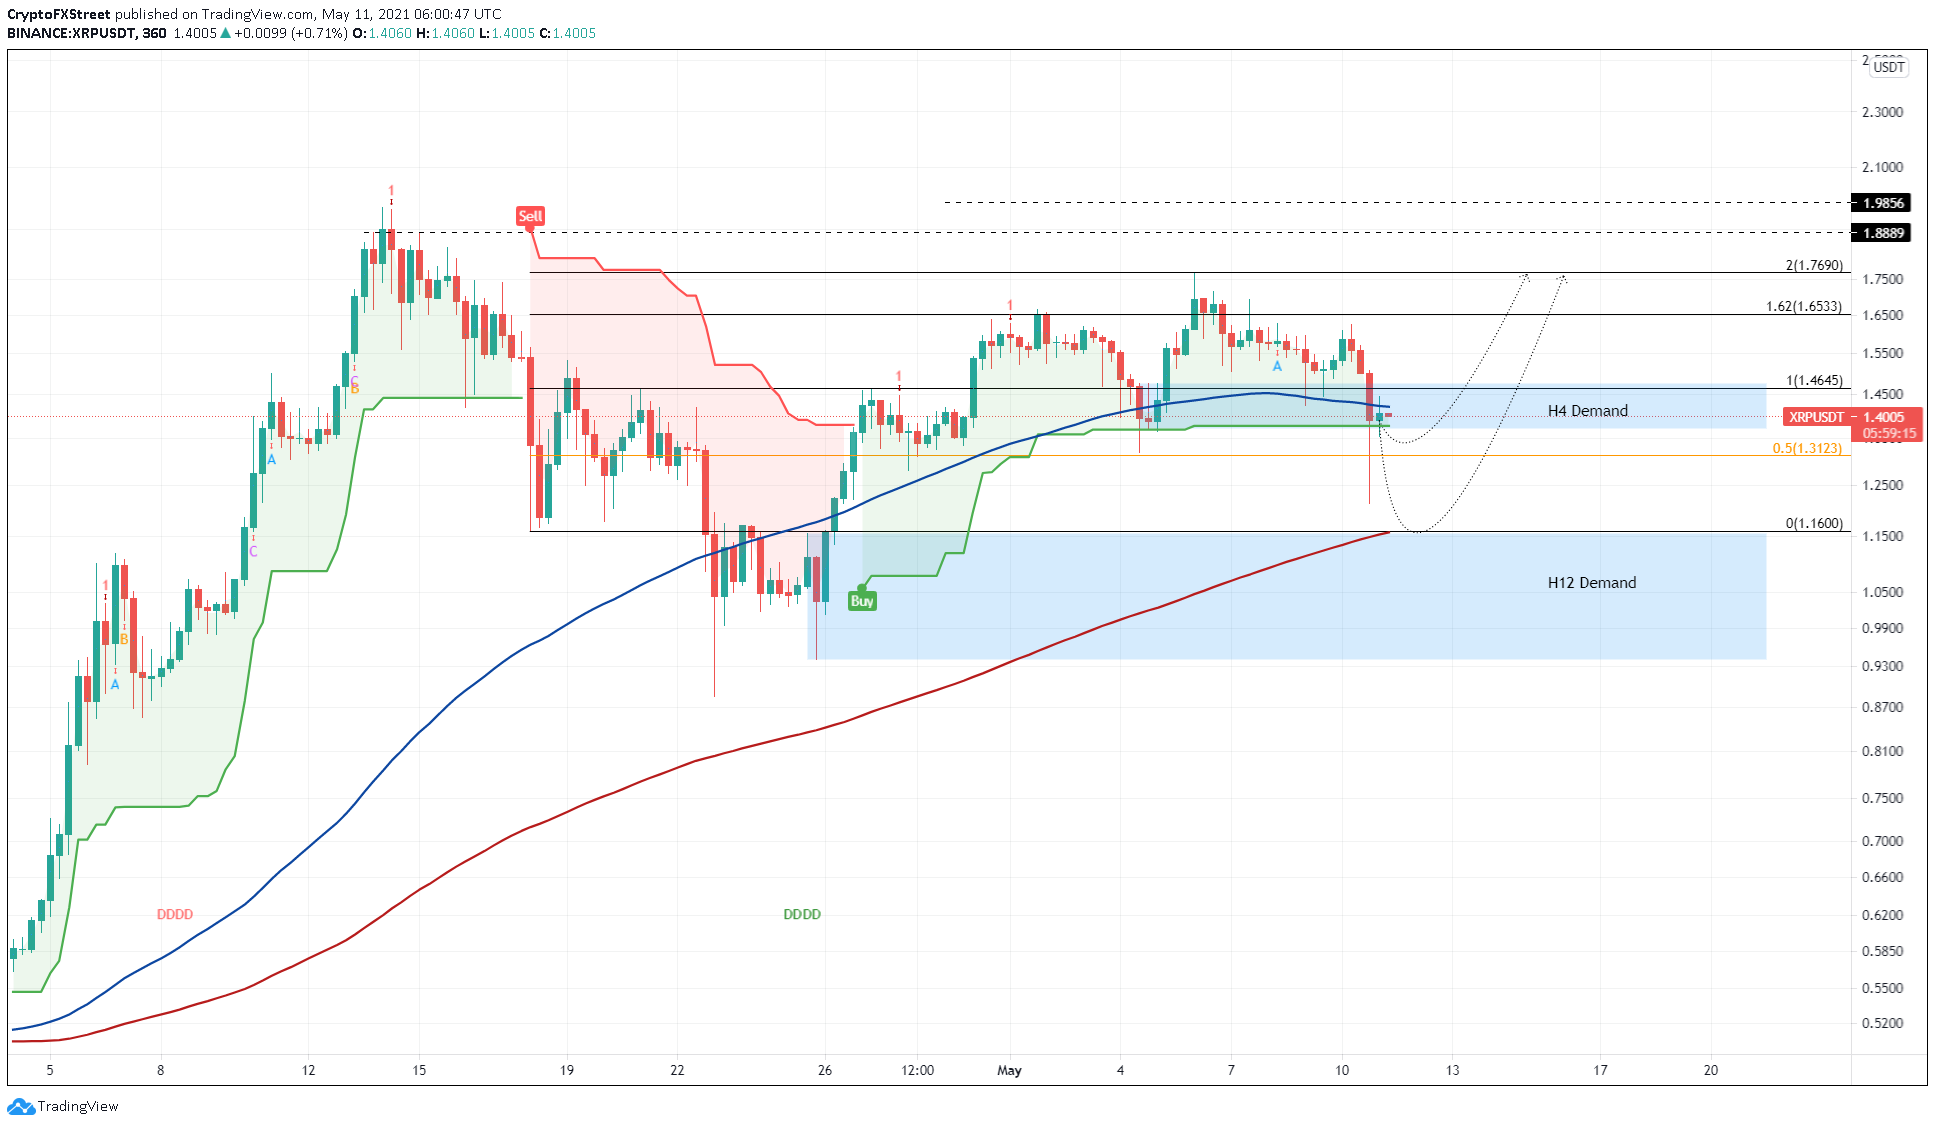
XRP/USDT 6-hour chart
However, if Ripple produces a decisive close below $0.941, it would eradicate any hopes of an upswing. If this bearish scenario were to evolve, XRP price could slide 6% to $0.886.