
- Bitcoin dipped close to $50,000, but the uptrend remains in jeopardy.
- Quarterly CME Bitcoin options could see Bitcoin’s recovery bolstered.
- Ethereum deals with Lethargic price action despite support at $1,550.
- Ripple faces immense overhead pressure, limiting movement toward $0.6.
The cryptocurrency market is trying to find stability after a widespread retreat from the beginning of the week. Bitcoin plummeted to $50,000, followed by an ongoing lethargic recovery. Ethereum is having a hard time sustaining gains despite the crucial support at $1,550. On the other hand, Ripple is among the most improved altcoins, posting a 9% growth in value over the last 24 hours.
Some selected altcoins have recorded double-digit gains including Terra (up 14%), TRON (up 10%), Elrond (up 10.8%) and PancakeSwap (up 16.5%). As the weekend session is ushered in, investors expect most digital assets to gain ground from the prevailing price levels.
Bitcoin struggles with the uptrend despite options expiration
The quarterly Chicago Mercantile Exchange (CME) Bitcoin and Ethereum contracts are set to expire on March 26. Note that open interest in the options market is used to control the number of active contracts and, by extension, highlights the level of liquidation at particular expiration dates. However, it is essential to note that the impact of the options could vary and does not always lead to an uptick in the Bitcoin price.
Meanwhile, Bitcoin is trading slightly above the descending channel’s middle boundary, as discussed earlier. A break under this could see BTC revisit the support at $50,000. If push comes to shove, losses may extend to $46,000 and $44,000, respectively.
BTC/USD 4-hour chart
It is worth noting that the uptrend staged from $50,000 may continue if BTC overcomes the short-term hurdle at the four-hour 200 Simple Moving Average (SMA). Another leg toward $56,000 will be validated by price action beyond the channel.
Ethereum struggles to find direction
Ethereum is stable, especially following the recently formed support at $1,550. However, recovery remains an uphill battle due to the resistance under $1,700. At the time of writing, Ether is exchanging hands at $1,625 amid a persistent push by the bulls to sustain the uptrend.
The Moving Average Convergence Divergence (MACD) indicator might confirm the recovery if it maintains a positive gradient. On the upside, price action above the four-hour 200 SMA could add credence to the bullish narrative, thus allowing bulls to focus on price levels past $1,700.
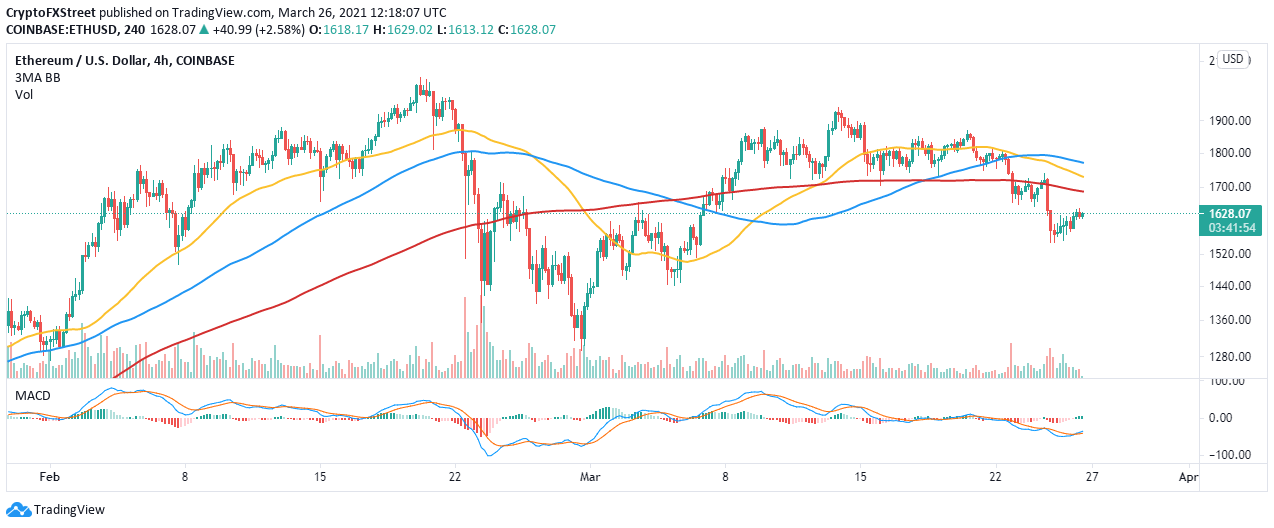
ETH/USD 4-hour chart
Ethereum is not out of the woods, mainly due to the lagging price action. A retreat into the $1,500s could trigger massive losses likely to seek tentative support areas at $1,400 and $1,200.
Ripple uptrend runs out of steam
Ripple soared above the support at $0.4, stepping above crucial resistance levels such as $0.5 and $0.55. Buyers shifted their eyes to $0.6 and $0.65, but the upswing to these levels appears to be a pipedream.
In the meantime, XRP is doddering at $0.56 while struggling to sustain recovery to the mentioned levels. The TD Sequential indicator may present a sell signal in the form of a green nine candlestick in the coming days. If the call to sell is validated, a correction may ensue in one to four four-hour candlesticks.
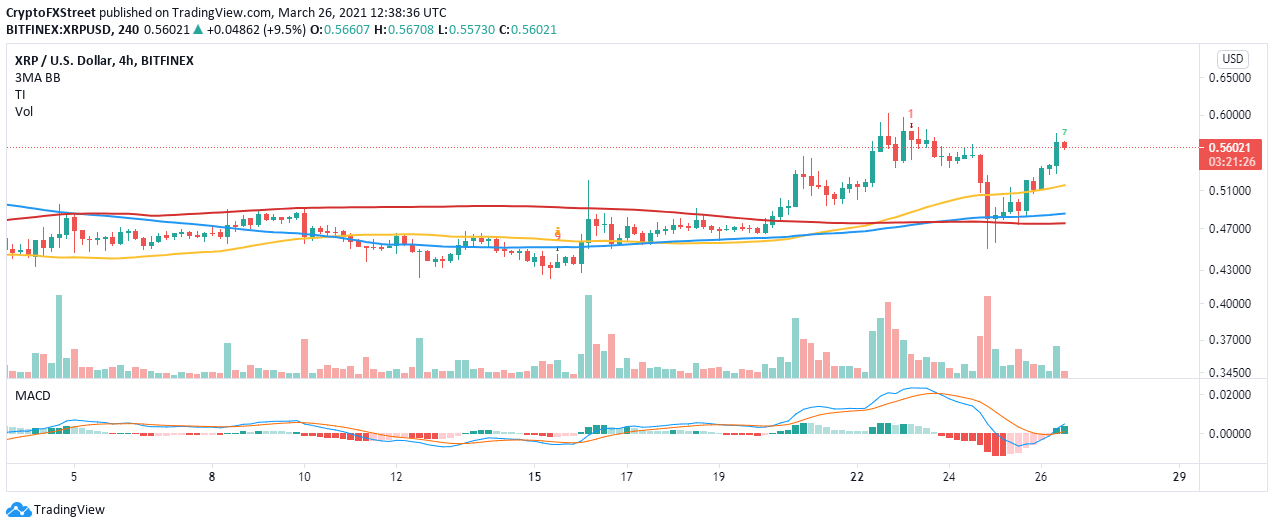
XRP/USD 4-hour chart
The MACD on the four-hour chart affirms the uptrend despite the sluggish price action above $0.5. This indicator is used in identifying positions to buy the dip or sell the top. The MACD line (blue) crossing above the signal line implies that investors can take a long position.