

- Litecoin price is contained inside an ascending parallel channel on the 4-hour chart.
- The digital asset faces only one barrier ahead which could propel its price to $200.
- A notable number of whales have exited Litecoin, adding some selling pressure.
Litecoin has been trading in a steady and robust uptrend since the beginning of 2021. It is now facing one crucial resistance level at $175 before its final breakout towards the psychological level at $200.
Litecoin price can quickly jump to $200
On the 4-hour chart, Litecoin is contained inside an ascending parallel channel. There is a strong support level below the current price at $162 from which LTC is looking for a rebound.
LTC/USD 4-hour chart
The In/Out of the Money Around Price (IOMAP) chart shows practically no resistance levels ahead. The most significant barrier is located between $171 and $176 which coincides with the upper resistance trendline of the parallel channel.
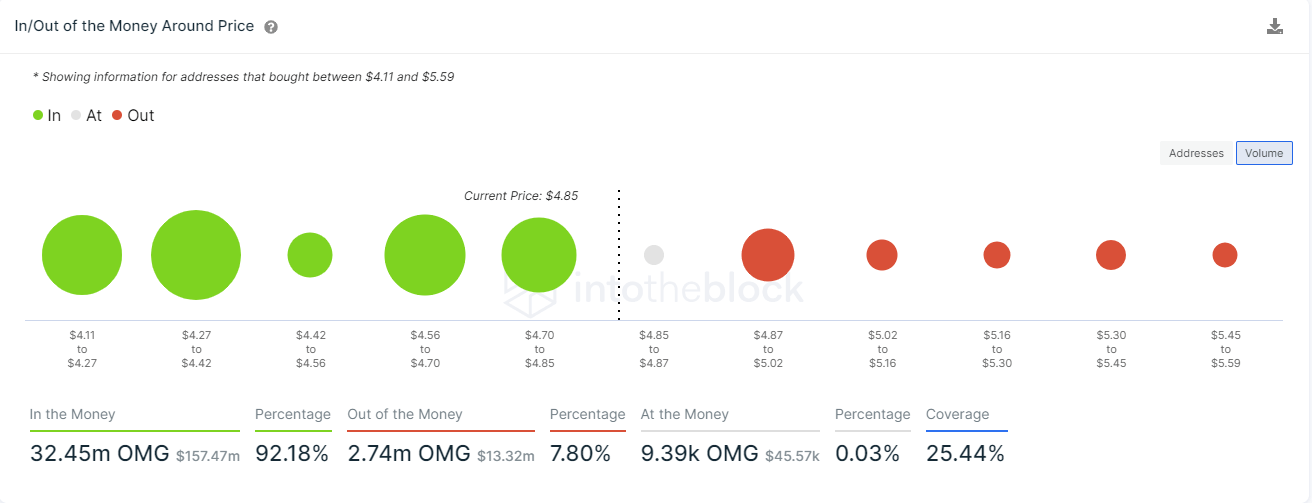
LTC IOMAP chart
A breakout above this point can easily drive Litecoin price towards $200 as the resistance ahead is weak. Additionally, the IOMAP model shows a lot of support below $160.
%20[15.57.50,%2009%20Feb,%202021]-637484794768523645.png)
LTC Holders Distribution
However, the number of whales holding between 100,000 and 1,000,000 LTC coins ($16,600,000 and $166,000,000) has declined considerably in the past week by six, which indicates large investors have been taking profits expecting a correction.
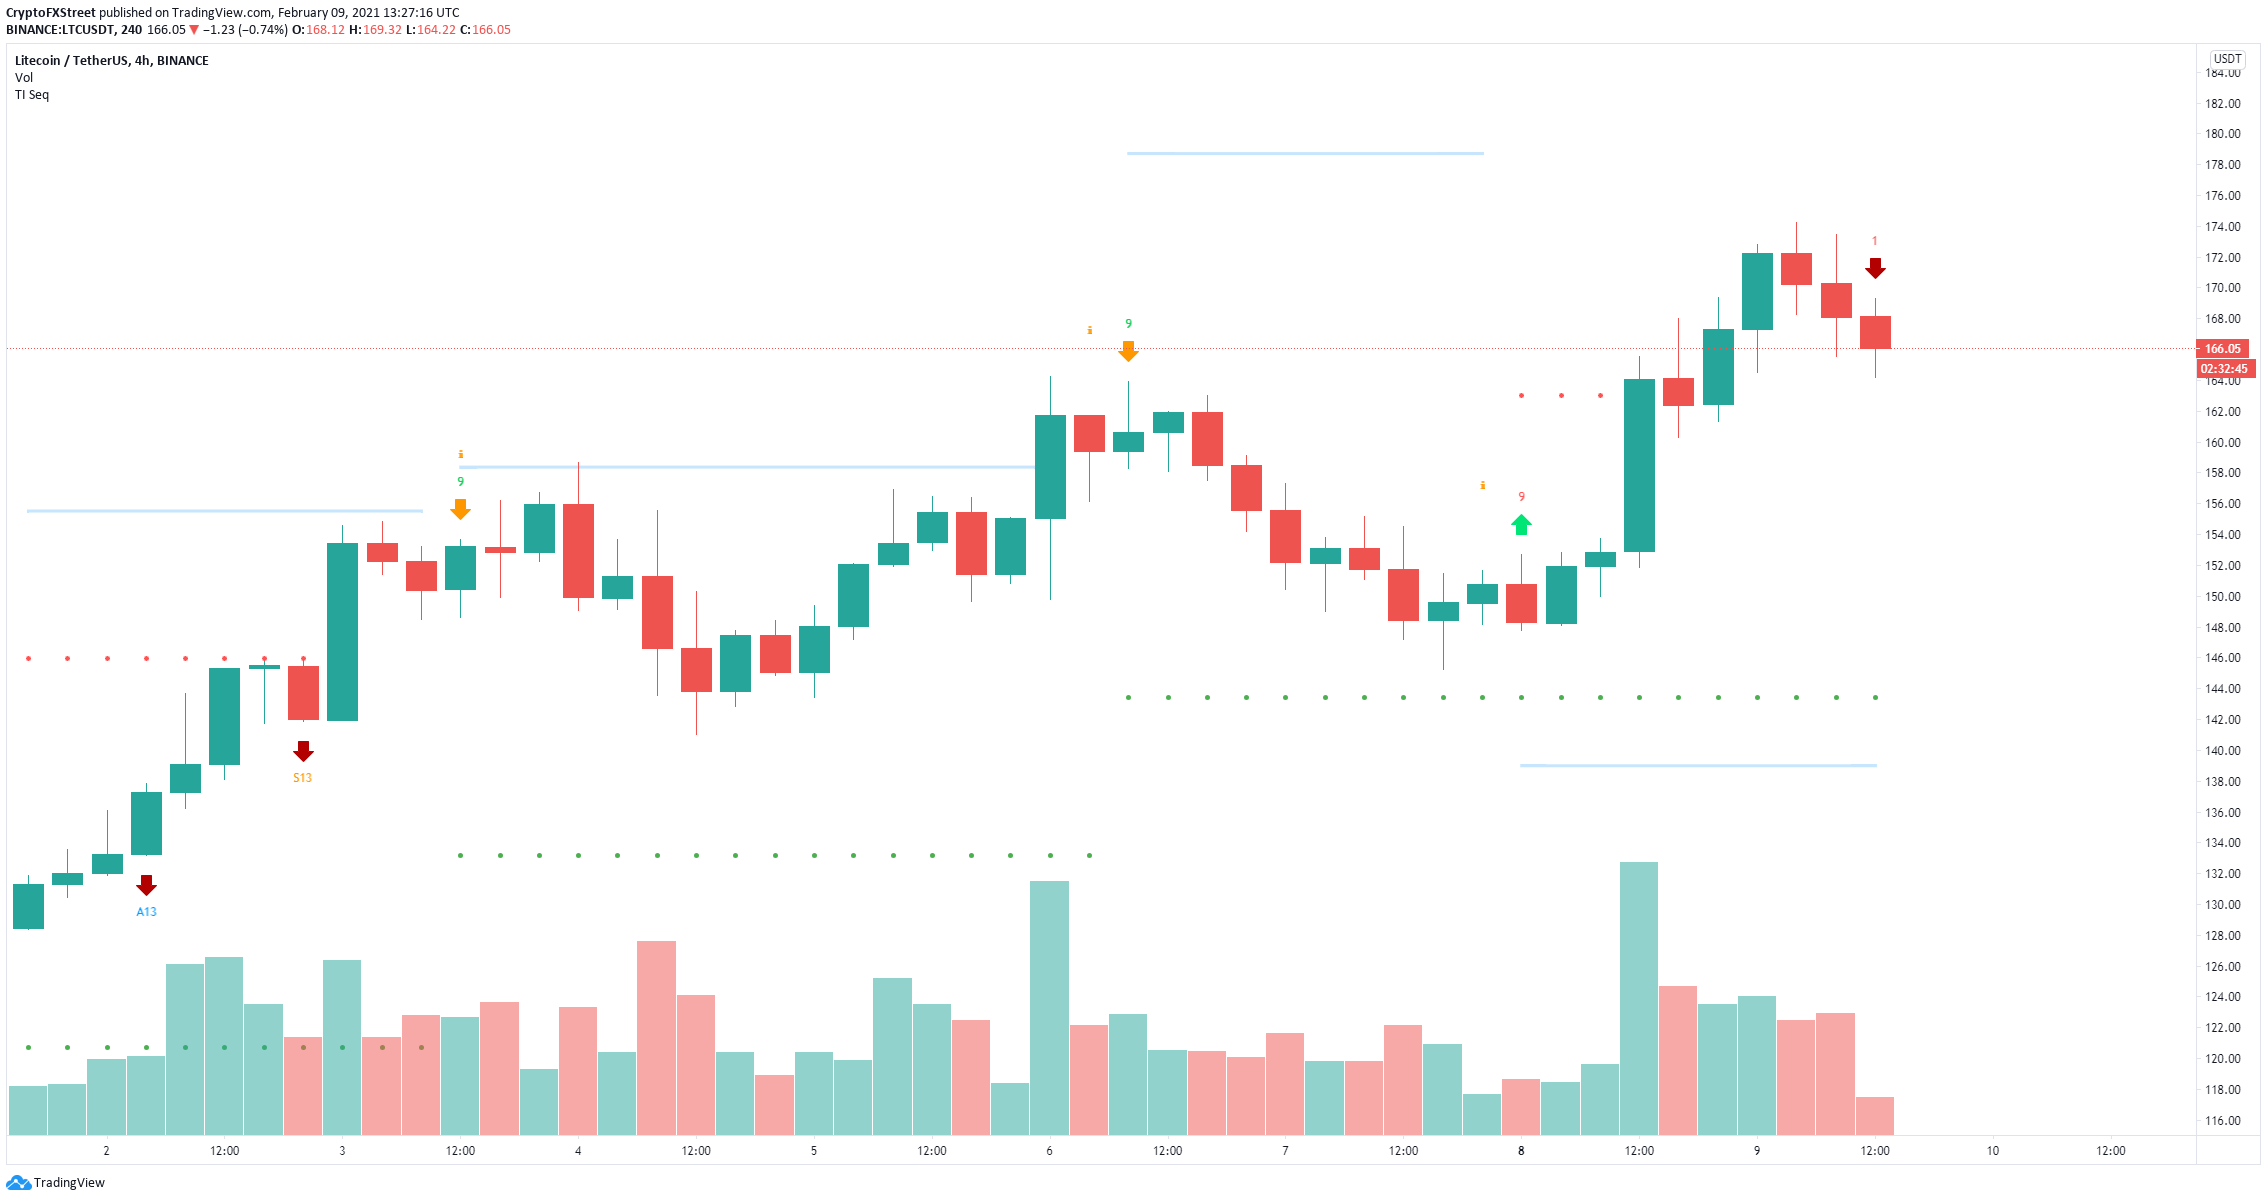
LTC/USD 4-hour chart
On the 4-hour chart, the TD Sequential indicator has presented a sell signal which has been accurate in the past. Litecoin price could fall towards the middle trendline of the parallel channel at $160 and as low as $152 to retest the lower boundary.


