
The Litecoin (LTC) price has increased significantly so far in January but was recently rejected by a long-term resistance level at $186.
While it is possible that Litecoin is still in a corrective phase, another upward move is expected that could take LTC toward $225.
Long-Term Litecoin Levels
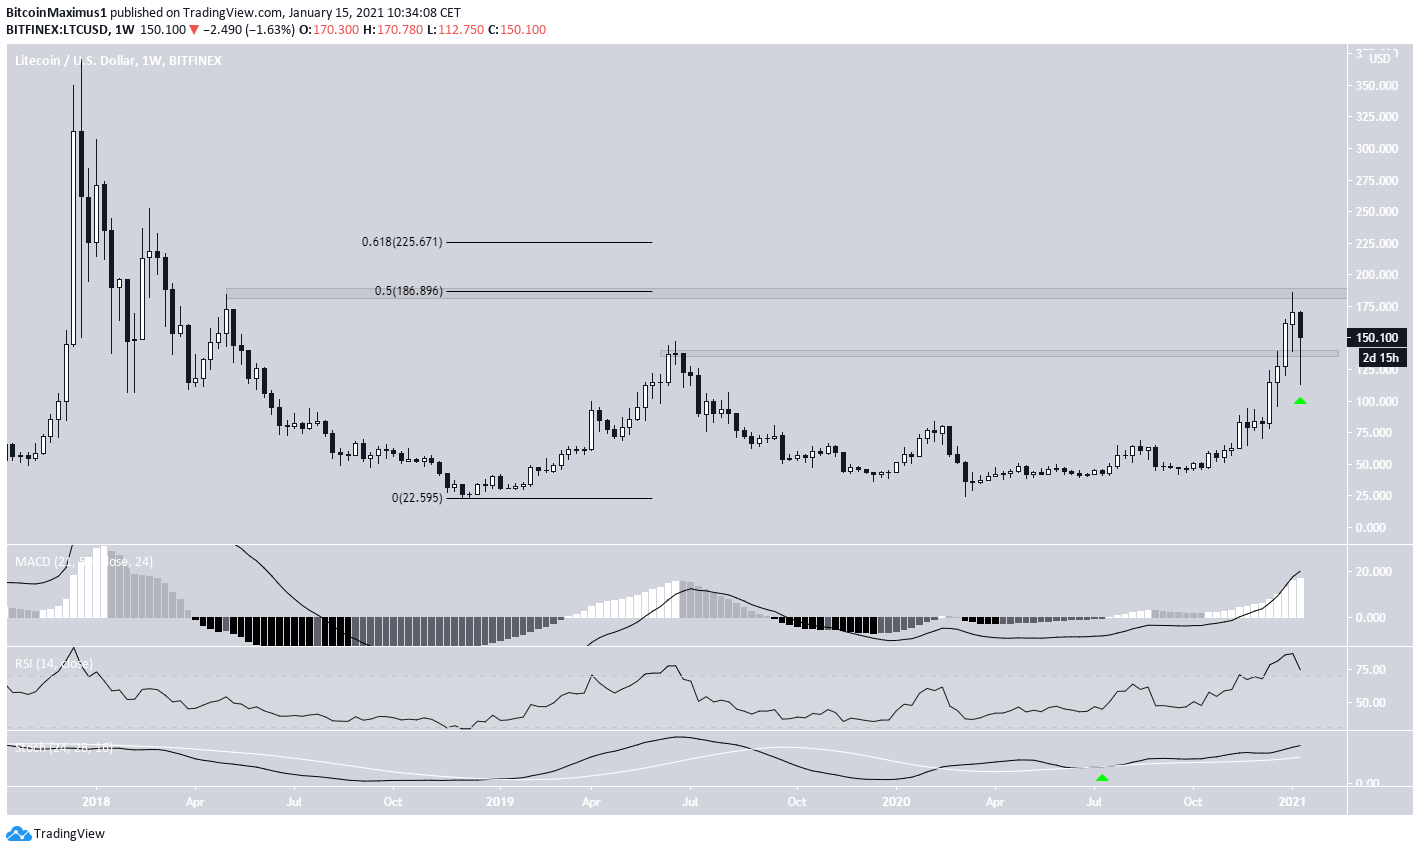
Litecoin has been decreasing since Jan. 10, after reaching a high of $185.83. The high coincided with the 0.5 Fib retracement level measuring from the all-time high of $370, validating the area as resistance.
However, after the drop, LTC has held on above the June 2019 high of $146 and created a very long lower wick in the process. This is a strong sign of buying pressure. A weekly close above this level would likely confirm a continued bullish trend.
Technical indicators in the weekly time-frame are bullish. If LTC manages to break out, the next resistance area would be found at $225 — the 0.618 Fib retracement level. An increase above this level could take LTC toward its all-time high.
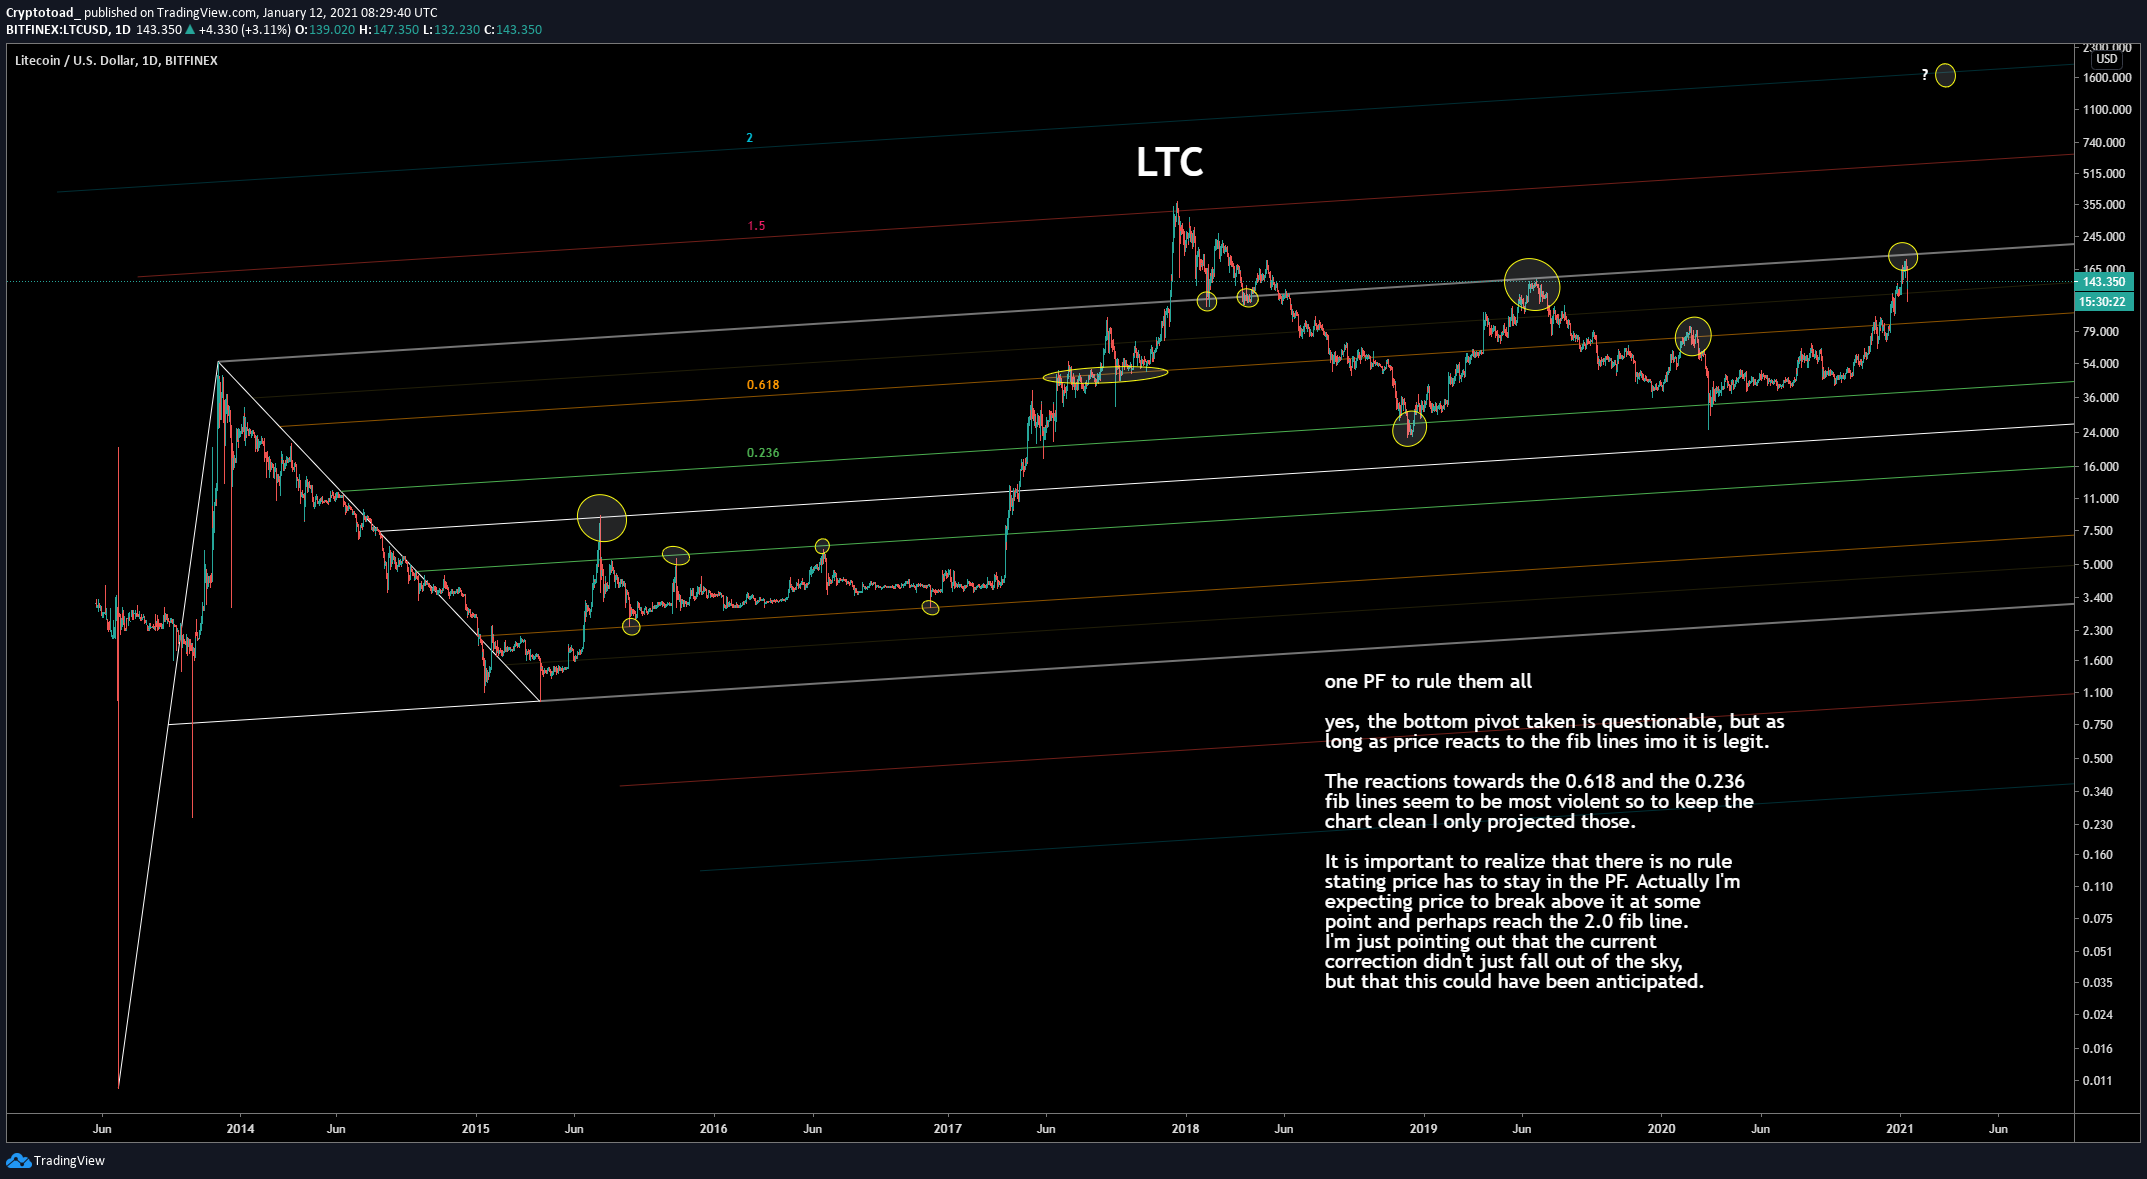
Cryptocurrency trader @Mesawine1 outlined an LTC chart, stating that a move above the primary resistance could trigger a very rapid increase.
This aligns with our analysis, though the method used to get there is not quite the same.

Short-Term Movement
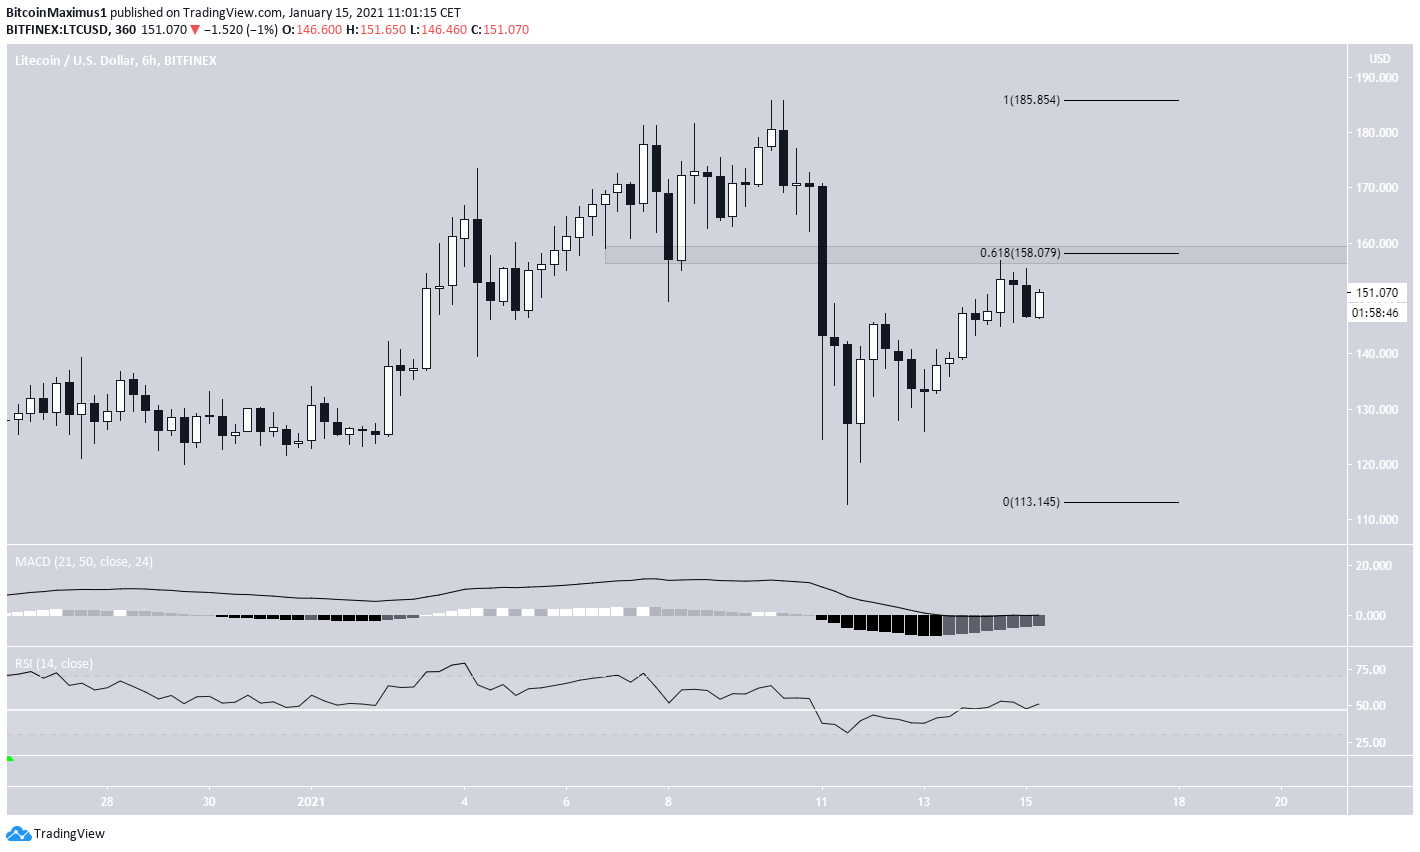
Shorter-term charts show that LTC is currently making an attempt to move above the 0.618 Fib retracement level of $158. The level also previously acted as support, so reclaiming it is crucial if LTC wants to continue moving higher.
Despite the fact that indicators are bullish, we cannot consider the short-term trend bullish unless LTC manages to close above this level.

LTC Wave Count
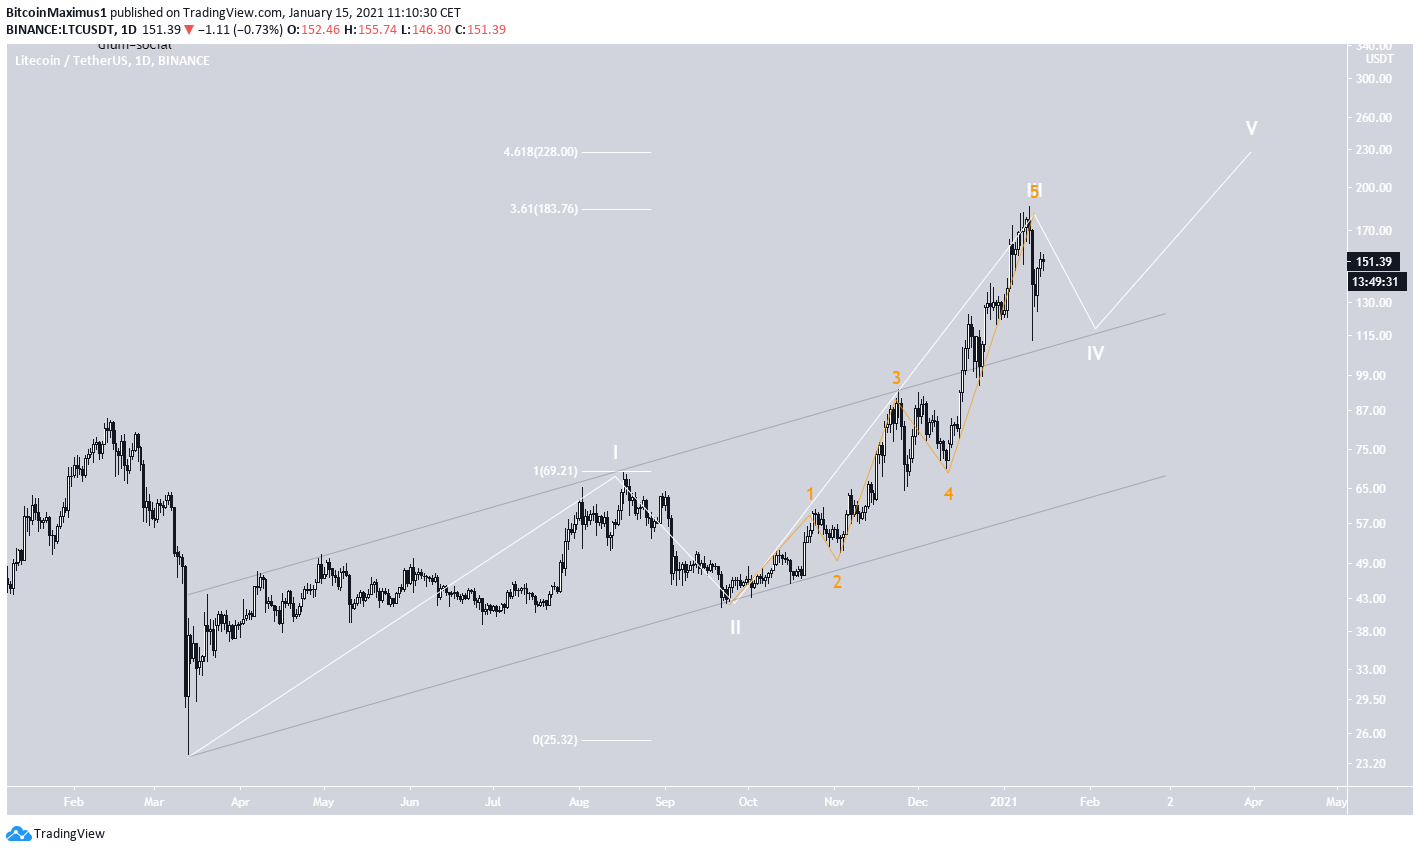
The wave count suggests that LTC has completed wave 3 (shown in white below) of a bullish impulse that began in March.
Wave 3 ended right at the 3.61 Fib extension of wave 1, and it looks like wave 4 has begun. It’s possible that LTC touched the parallel channel once again and completed a fourth wave pullback pattern in the process.
A likely target for the top of the entire move is found at $228, the 4.618 Fib extension of wave 1 and the resistance area outlined in the first section.
The sub-wave count is shown in orange.
*The logarithmic chart is used in the image below.
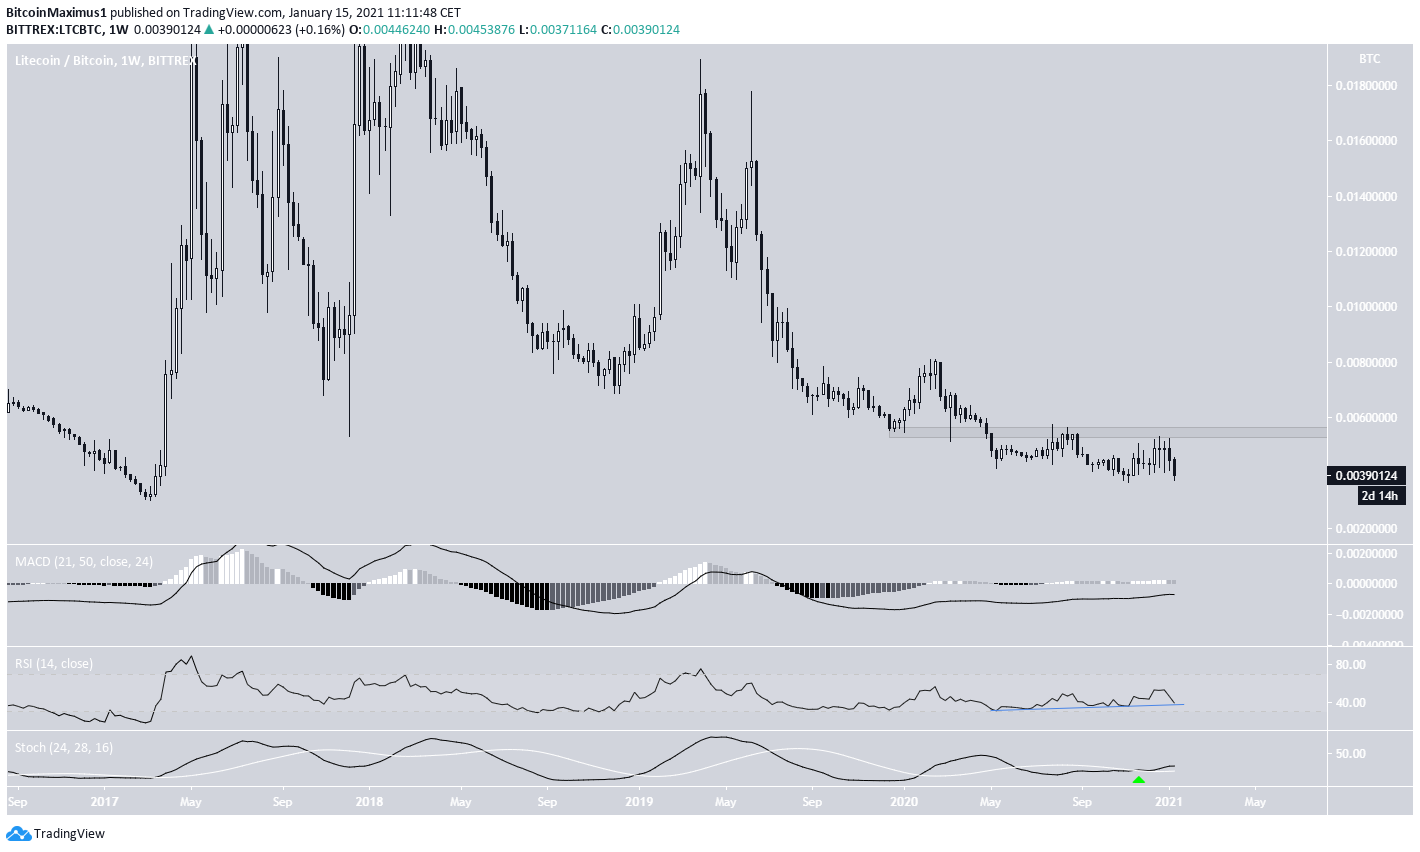
LTC/BTC
The LTC/BTC chart shows a significant bullish divergence developing in the weekly RSI.
This is a strong sign of a trend reversal, strengthened by the bullish cross in the Stochastic oscillator and the fact that LTC is trading close to a long-term support area.
Nevertheless, the trend cannot be considered bullish until LTC flips the ₿0.0056 resistance area.
Conclusion
The long-term trend for Litecoin seems to be bullish, but a short-term retracement could occur before another upward move.
While technical indicators predict a bullish reversal for LTC/BTC, the trend cannot be considered bullish until LTC reclaims the ₿0.0056 resistance area.
For BeInCrypto’s latest Bitcoin (BTC) analysis, click here!
Disclaimer: Cryptocurrency trading carries a high level of risk and may not be suitable for all investors. The views expressed in this article do not reflect those of BeInCrypto.