
ETH/USD rose to highs of $1,352 before sell-off pressure pushed it to a major support level at $1,000
Ethereum (ETH) corrected to the $1,000 support level, losing the upside momentum that had brought bulls so close to a new all-time high. Before correcting, ETH/USD had surged by about 89% since 2 January, reaching highs of $1,352 on BitStamp.
ETH price currently hovers around $1,085 on most exchanges. As seen on CoinMarketCap, the second-largest cryptocurrency by market cap is down nearly 20% in the past 24 hours. At the time of writing, Ethereum’s market cap has also shrunk by about 17%, from $144 billion to about $125 billion.
But given Bitcoin’s dump to lows of $32,000 and subsequent rebound to around $35,000 (as of writing), it appears ETH/USD will follow suit.
On the daily chart, the key price area to watch is $1,065. A daily candle close above this line suggests that bulls will retain the upper hand. On the contrary, failure to keep the support level could see buyers forced to defend the 20-day EMA ($970) and the 50-day EMA ($772).
ETH/USD daily chart. Source: TradingView
While the broader correction as witnessed in the crypto sector has most digital assets trading lower for the first time in days, Bitcoin’s resilience above $35,000 could see bulls across the market regroup quickly. Ethereum appears to project this outlook on the 4-hour chart.
The 50% Fib retracement level offers an immediate support zone at $1,061, while the latest upside attempt is largely capped at the 61.8% Fibonacci retracement level ($1,131).
If bulls reclaim support above this minor resistance level, the next move could be a massive jump. The chart suggests the main barrier is at the 76.8% Fib retracement level of the swing to $1,352, which provides a barrier at $1,230.
The level is critical as it also mirrors another crucial price level—the 100 hourly simple moving average (100-SMA). This price curve is hugging the $1,227 line to suggest bulls might find strong support if they sustain upward momentum to the area above $1,230.
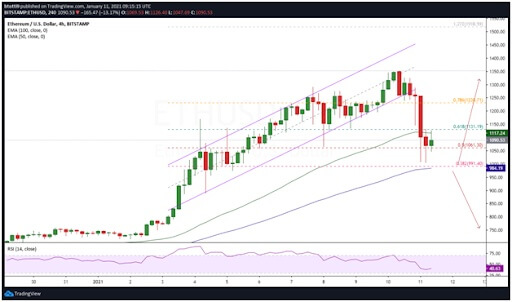
ETH/USD 4-hour chart. Source: TradingView
On the downside, Ethereum’s breakdown below $1,000 included a breach of the lower boundary of an ascending parallel channel. The 38.2% Fibonacci retracement level of the recent up move to $1,352 provided major support at $991 to prevent a retest of the 100-day EMA line ($984).
The RSI on the 4-hour chart is below 50 and is indicating a negative divergence. If ETH/USD drops below the key support zone at $991-$984, bearish pressure could push it to an initial support zone around $750.