
Bitcoin
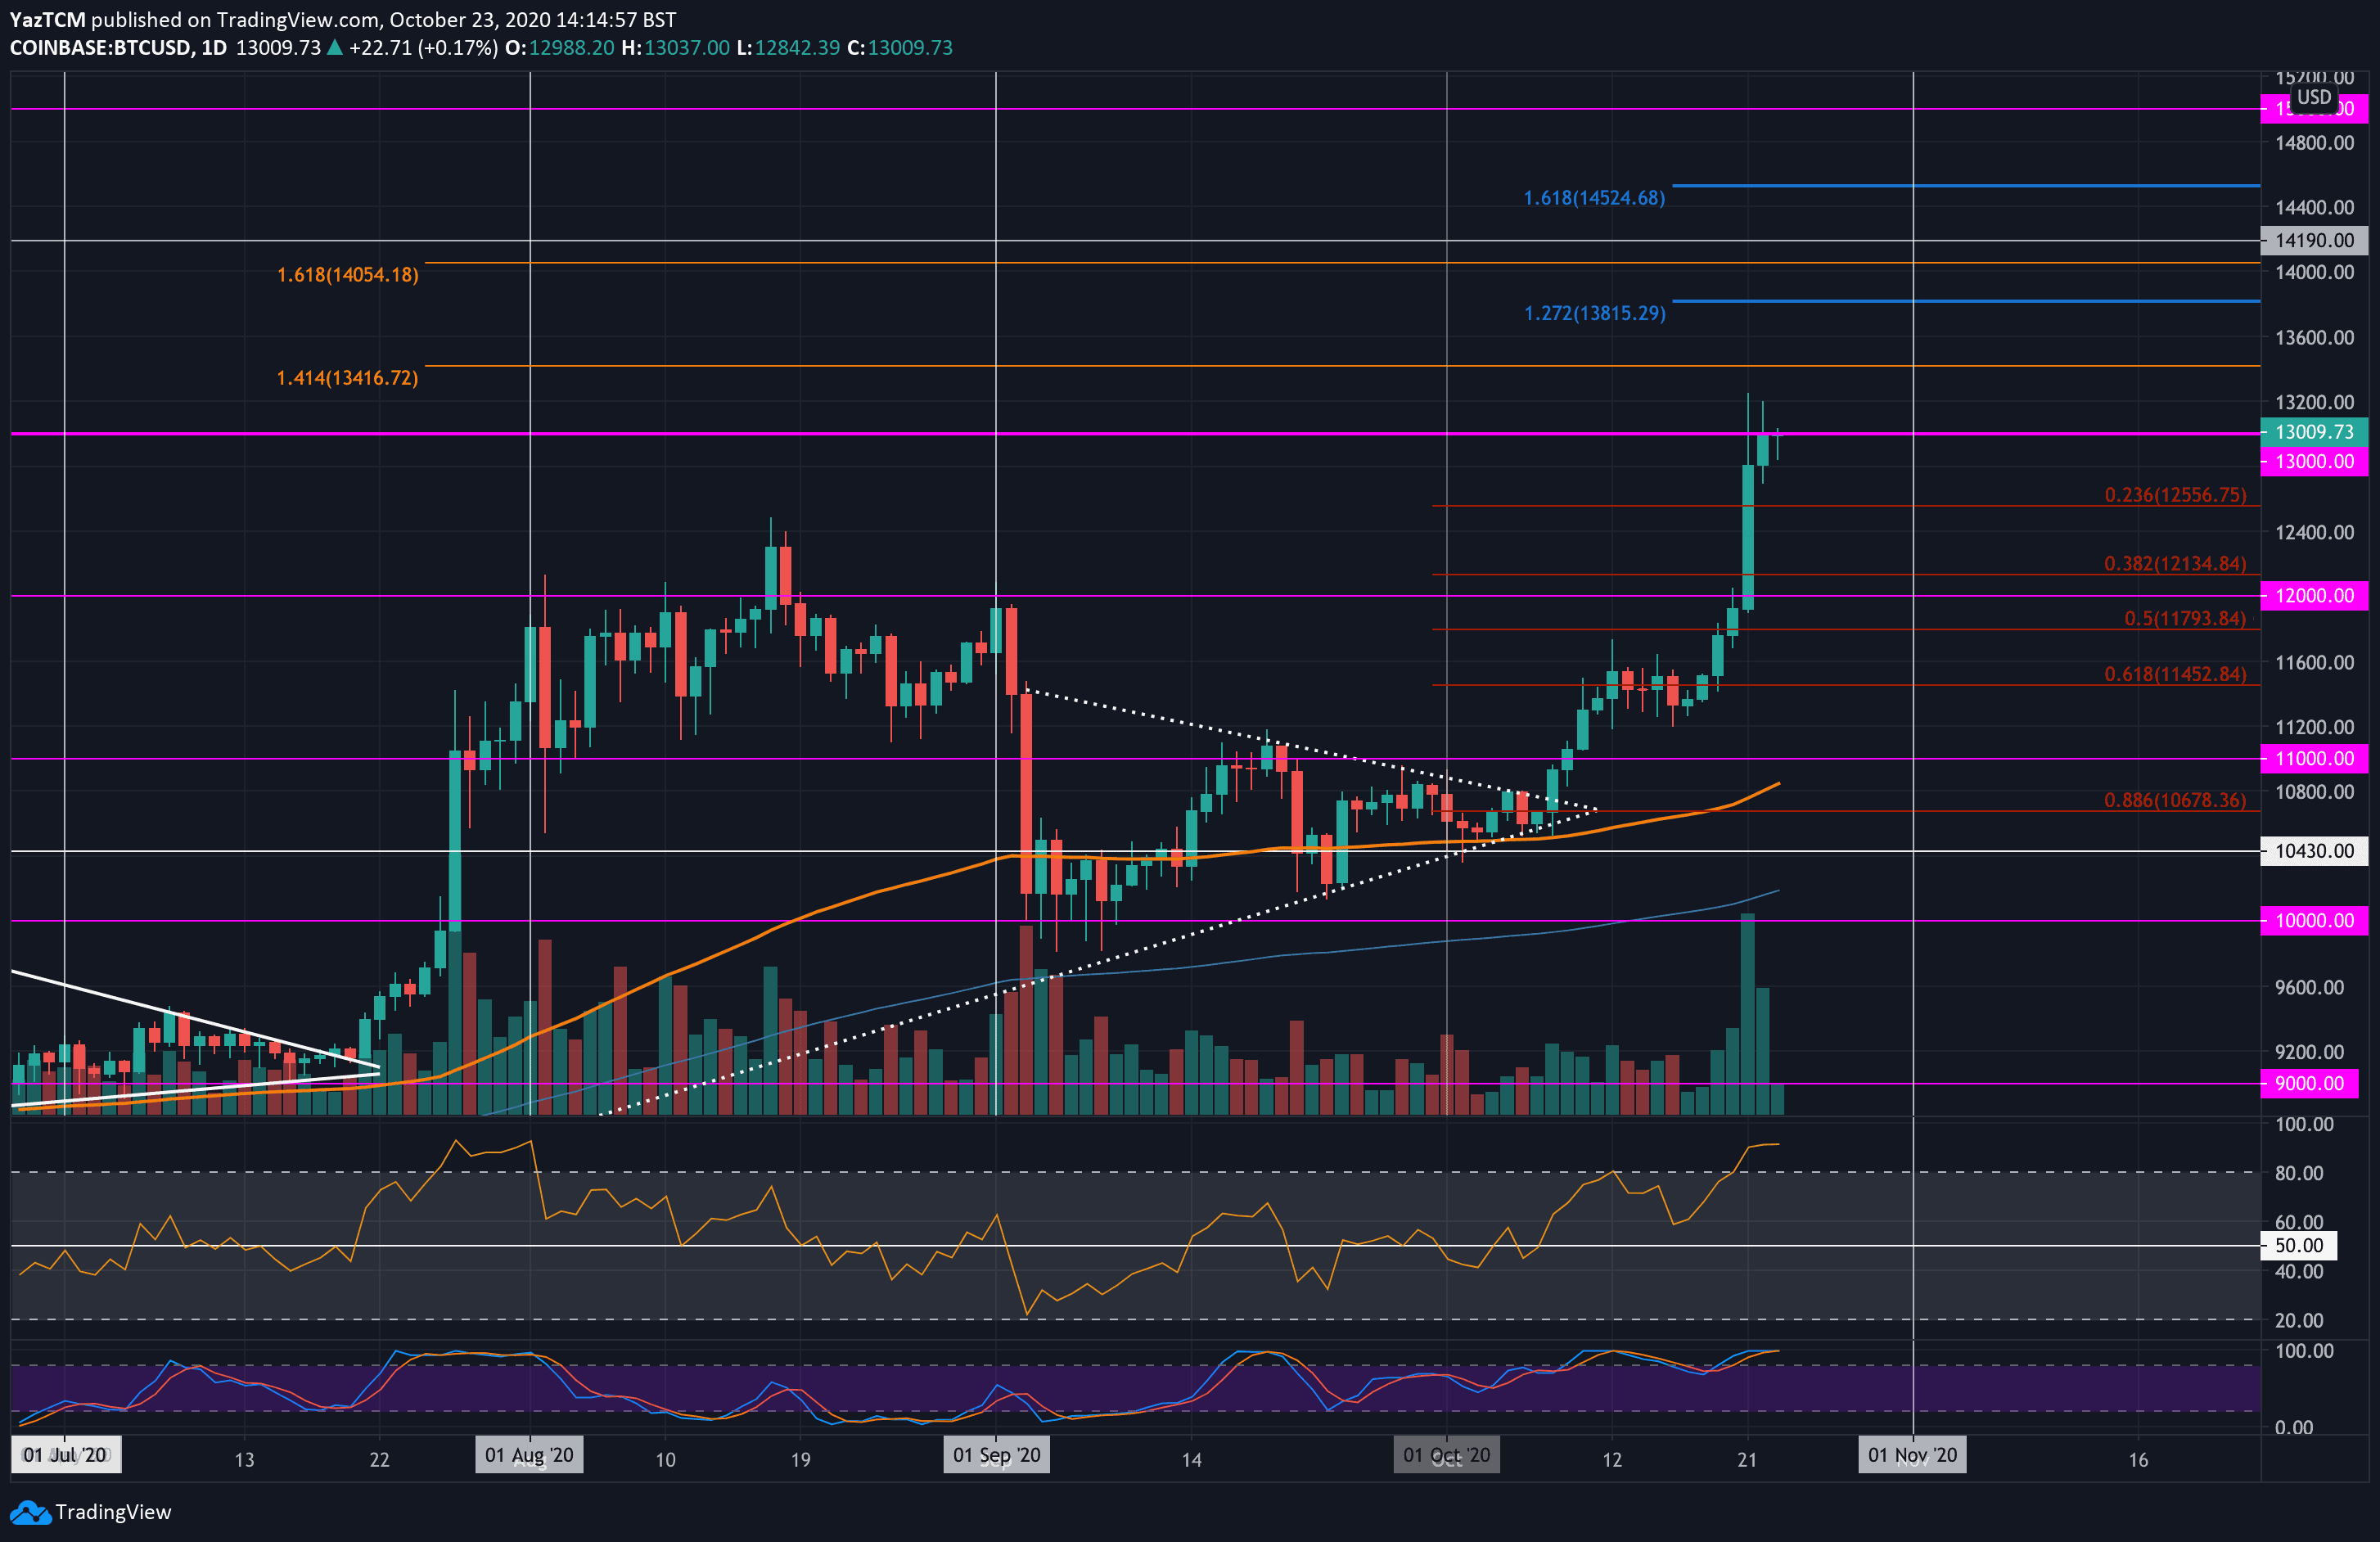
Bitcoin saw a very strong 13% price increase over the past seven days which allowed it to break above the $13,000 handle. At the start of October, Bitcoin managed to penetrate above a symmetrical triangle pattern which was the first sign that a bull run was about to form.
After the breakout, it managed to push as high as $11,600 before stalling. Last Friday, Bitcoin was trading at around $11,200 as it rebounded and started to push higher. It quickly reached the $12,000 level and broke above here on Wednesday. The coin continued upward until resistance was met at $13,000 – where it currently trades.
Looking ahead, once the buyers break $13,000, the first level of resistance lies at $13,200. Above this, resistance lies at $13,416 (1.414 Fib Extension), $13,500, $13,600, $13,815, and $14,000.
On the other side, the first level of support lies at $12,550 (.236 Fib Retracement). Beneath this, support lies at $12,400, $12,125 (.382 Fib Retracement), $12,000, and $11,800 (.5 Fib Retracement).
Ethereum
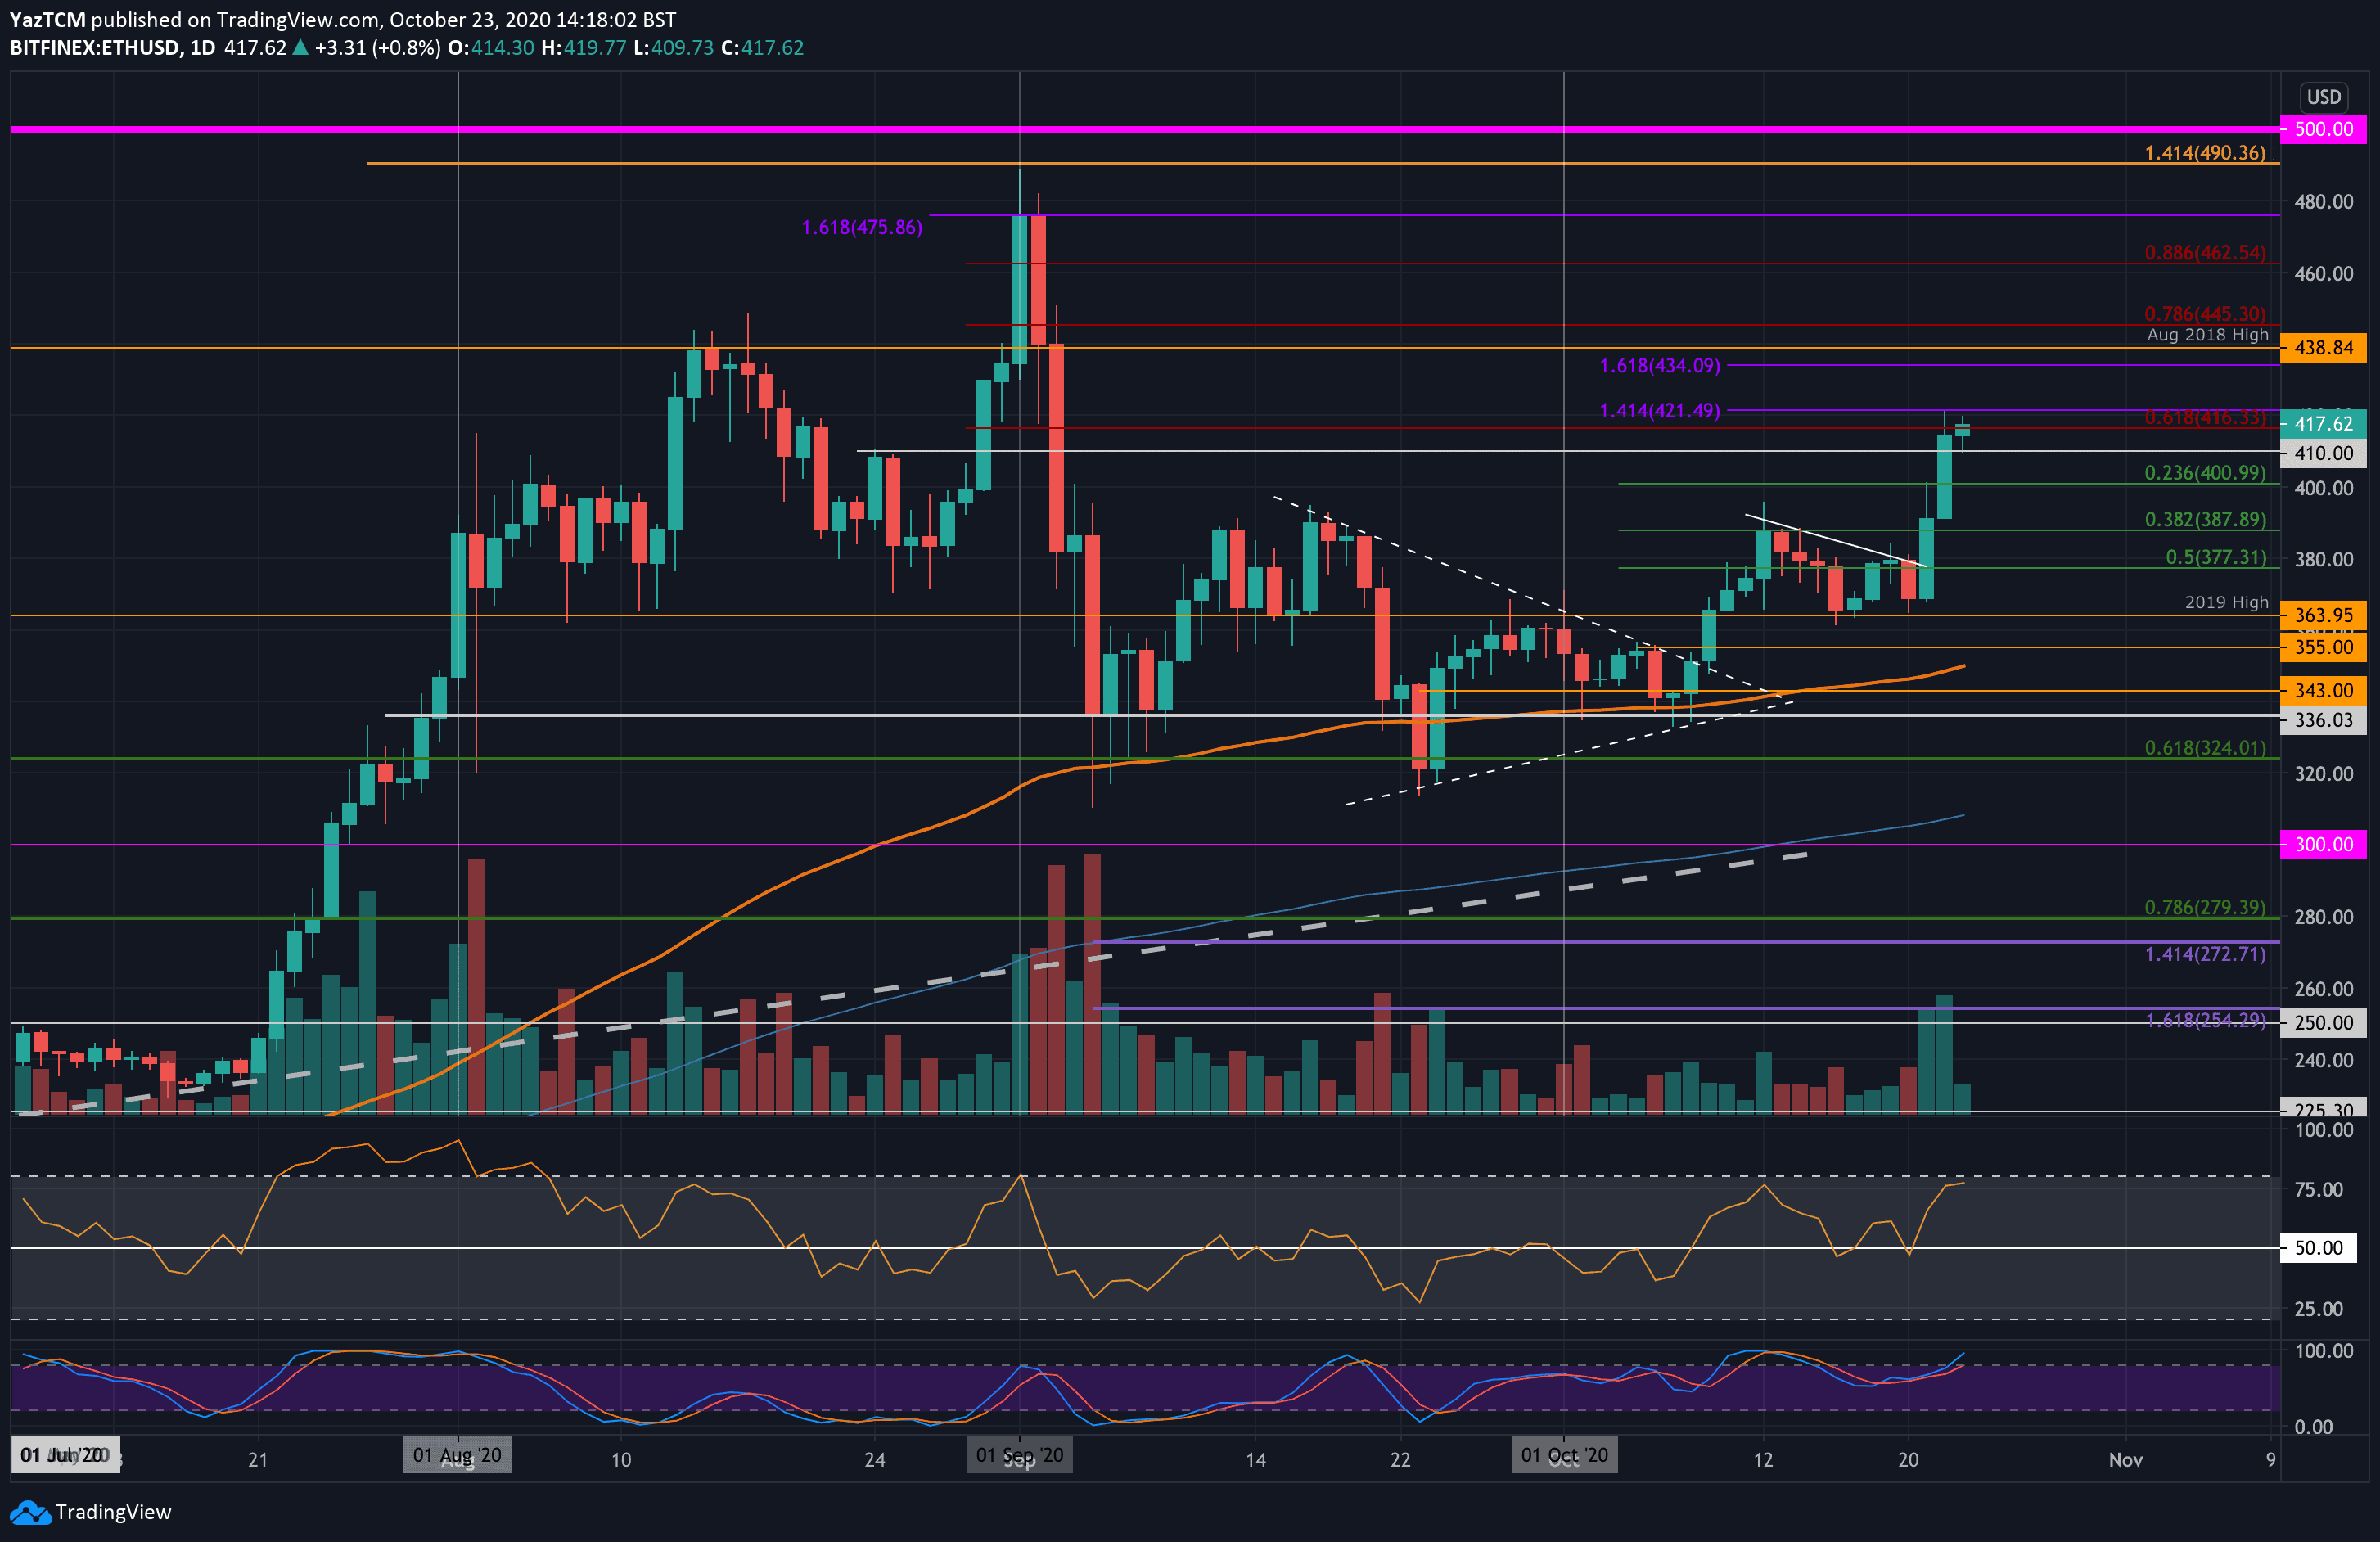
Ethereum witnessed a strong 10.5% price increase this week as it climbed above $400 to reach $418 today. Last Friday, Ethereum rebounded from the 2019 high at $264 and pushed higher into the short term falling trend line.
Ethereum went on to break this trend line on Wednesday as it surged higher to reach $400. Yesterday, the buyers pushed beyond $400 to spike into the resistance at $421.50 (1.414 Fib Extension). Unfortunately, it was unable to close the daily candle above the lower resistance at $416 (bearish .618 Fib Retracement).
Moving forward, if the buyers break the resistance at $421.50, higher resistance lies at $434 (1.618 FIb Extension), $439 (August 2018 Highs), and $445 (bearish .786 Fib Retracement). Beyond $450, added resistance lies at $462 (bearish .886 Fib Retracement), and $476.
On the other side, the first level of support lies at $410. This is followed by support at $400, $389 (.382 Fib), $377 (.5 Fib), and $364 (2019 High).
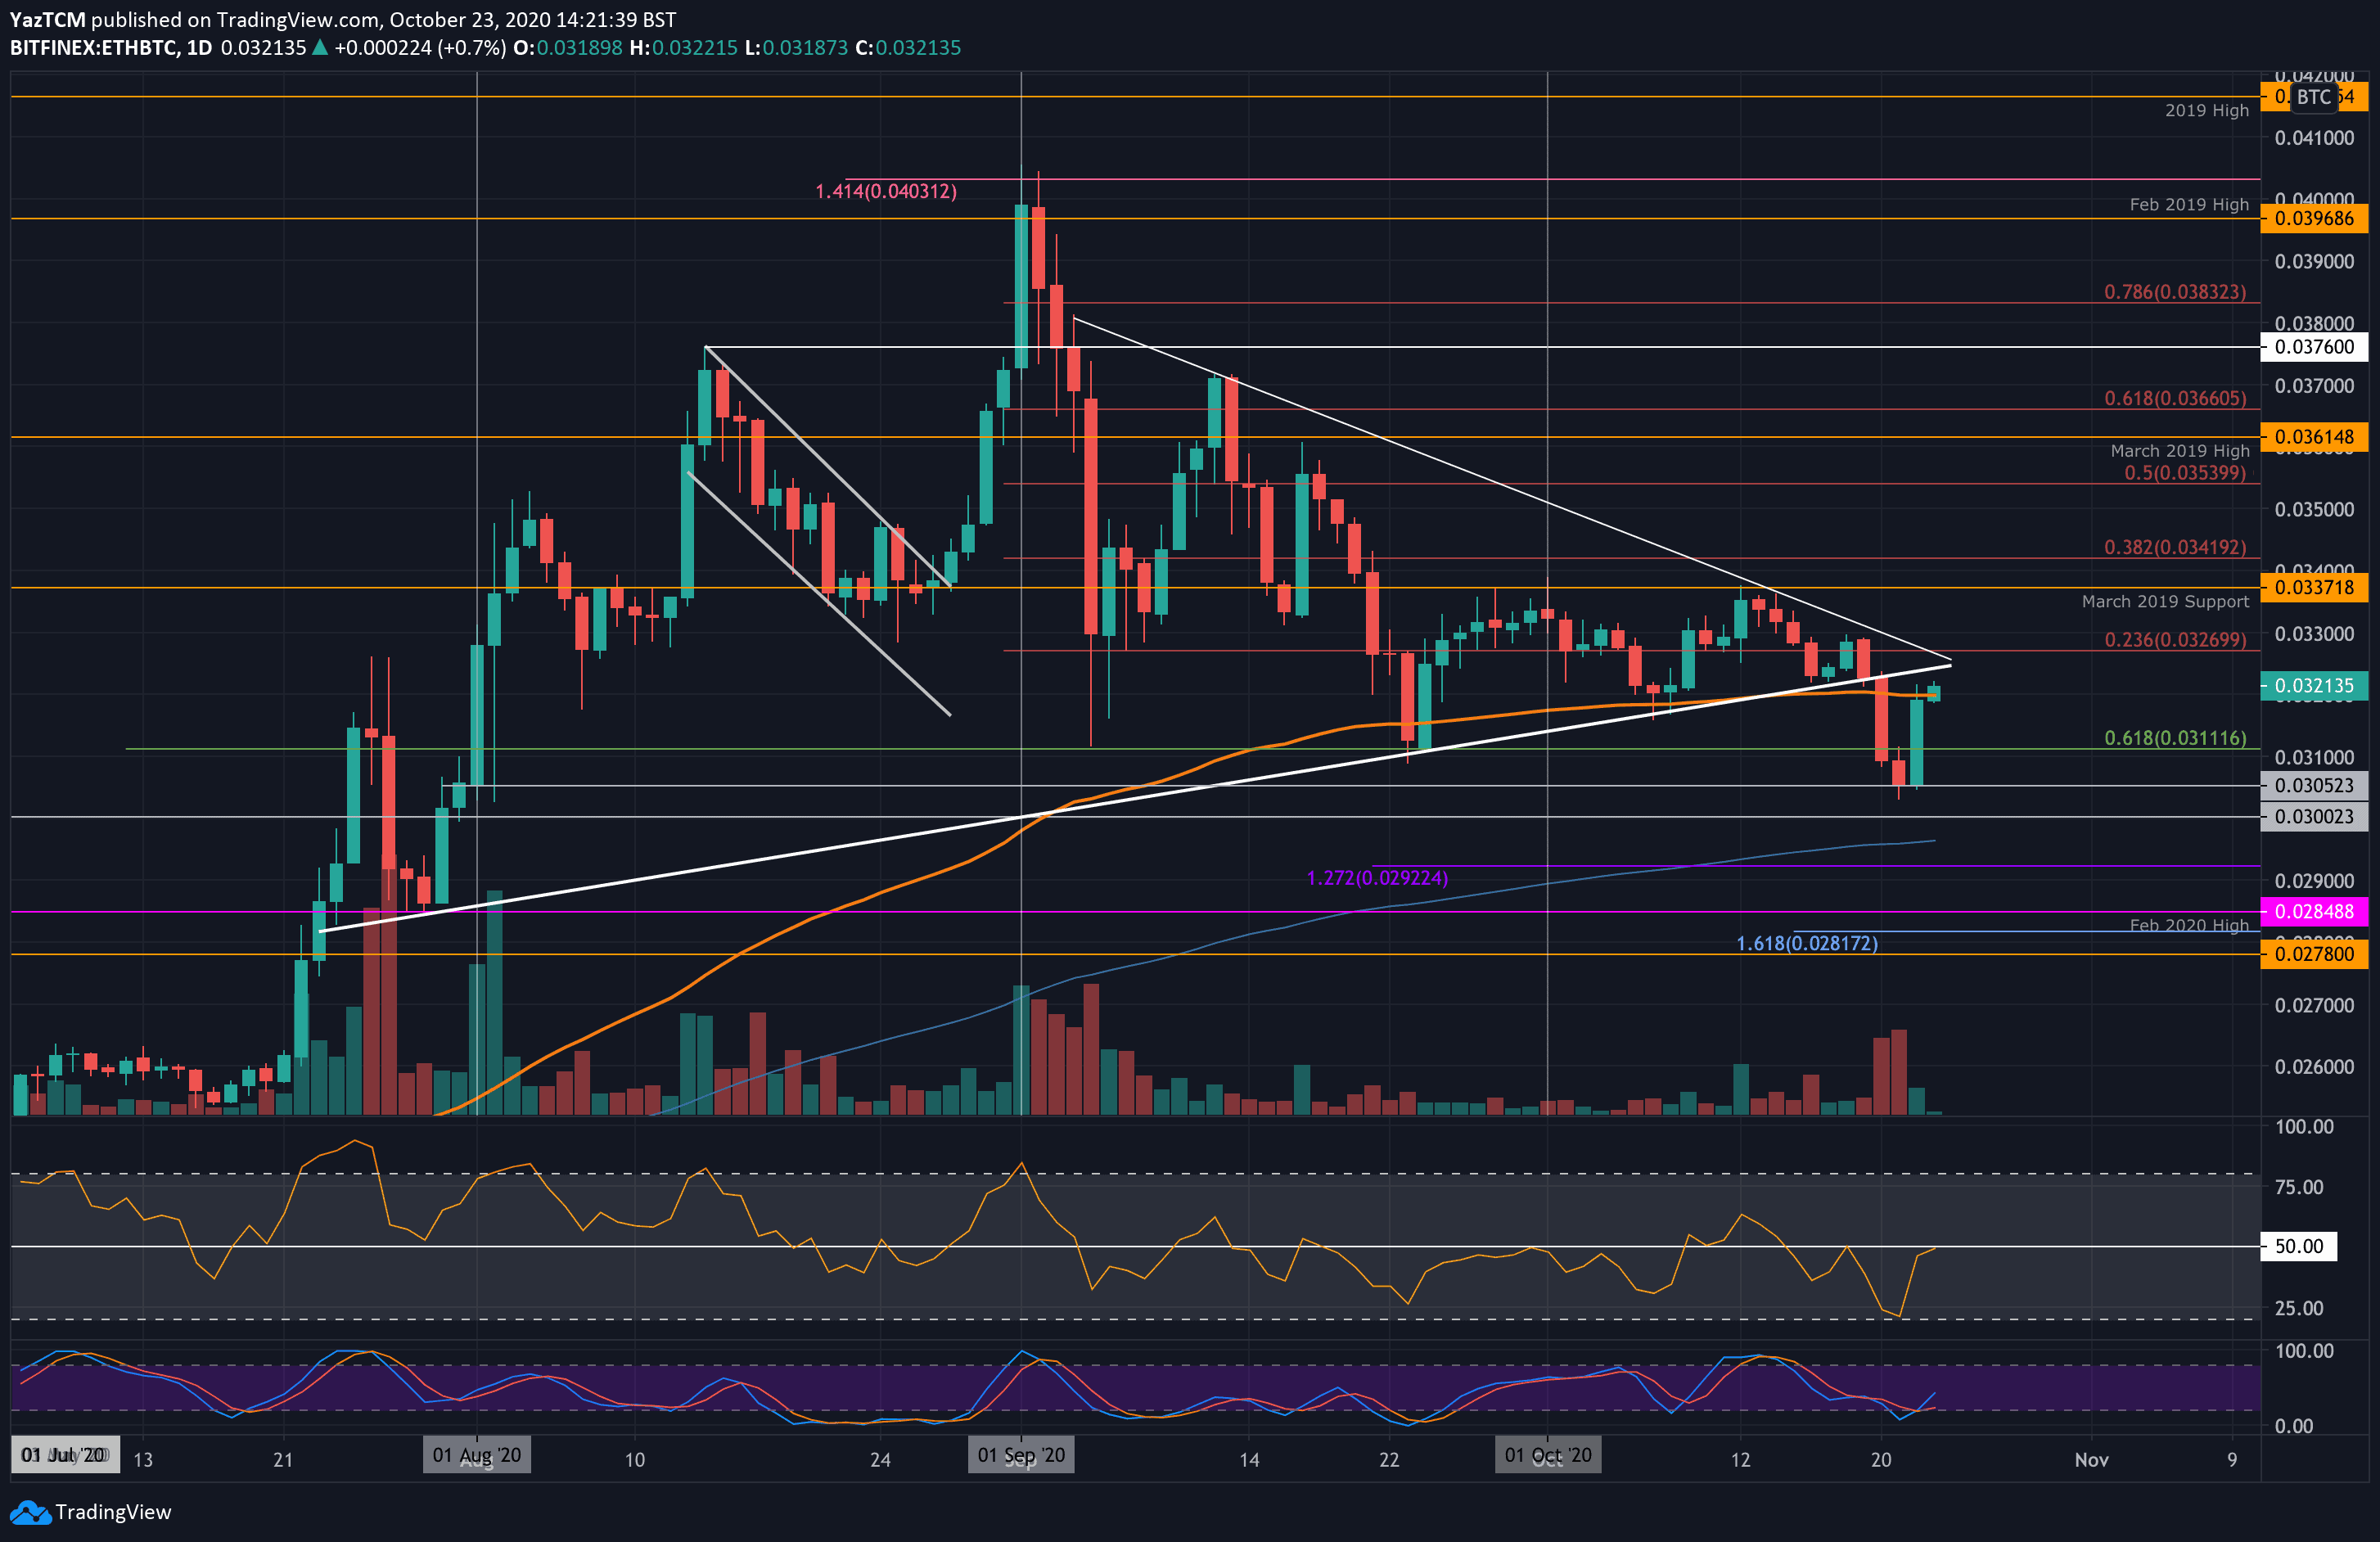
Against Bitcoin, Ethereum has struggled this week. On Tuesday, the coin dropped beneath a symmetrical triangle pattern as it fell beneath the 100-days EMA. It continued lower during the week until reaching support at 0.0305 BTC on Wednesday.
It managed to rebound from the support at 0.0305 BTC as it reached 0.0321 BTC today (100-days EMA).
Looking ahead, if the bulls push higher, the first level of resistance lies at 0.0327 BTC (bearish .236 Fib). Above this, resistance lies at 0.0337 BTC (March 2019 Support), 0.0341 BTC (bearish .382 Fib), 0.035 BTC, and 0.0353 (bearish .5 Fib).
On the other side, support lies at 0.032 BTC, 0.0311 BTC, 0.031 BTC, and 0.0305 BTC. Added support is found at 0.03 BTC and 0.0295 BTC (200-days EMA).
Ripple
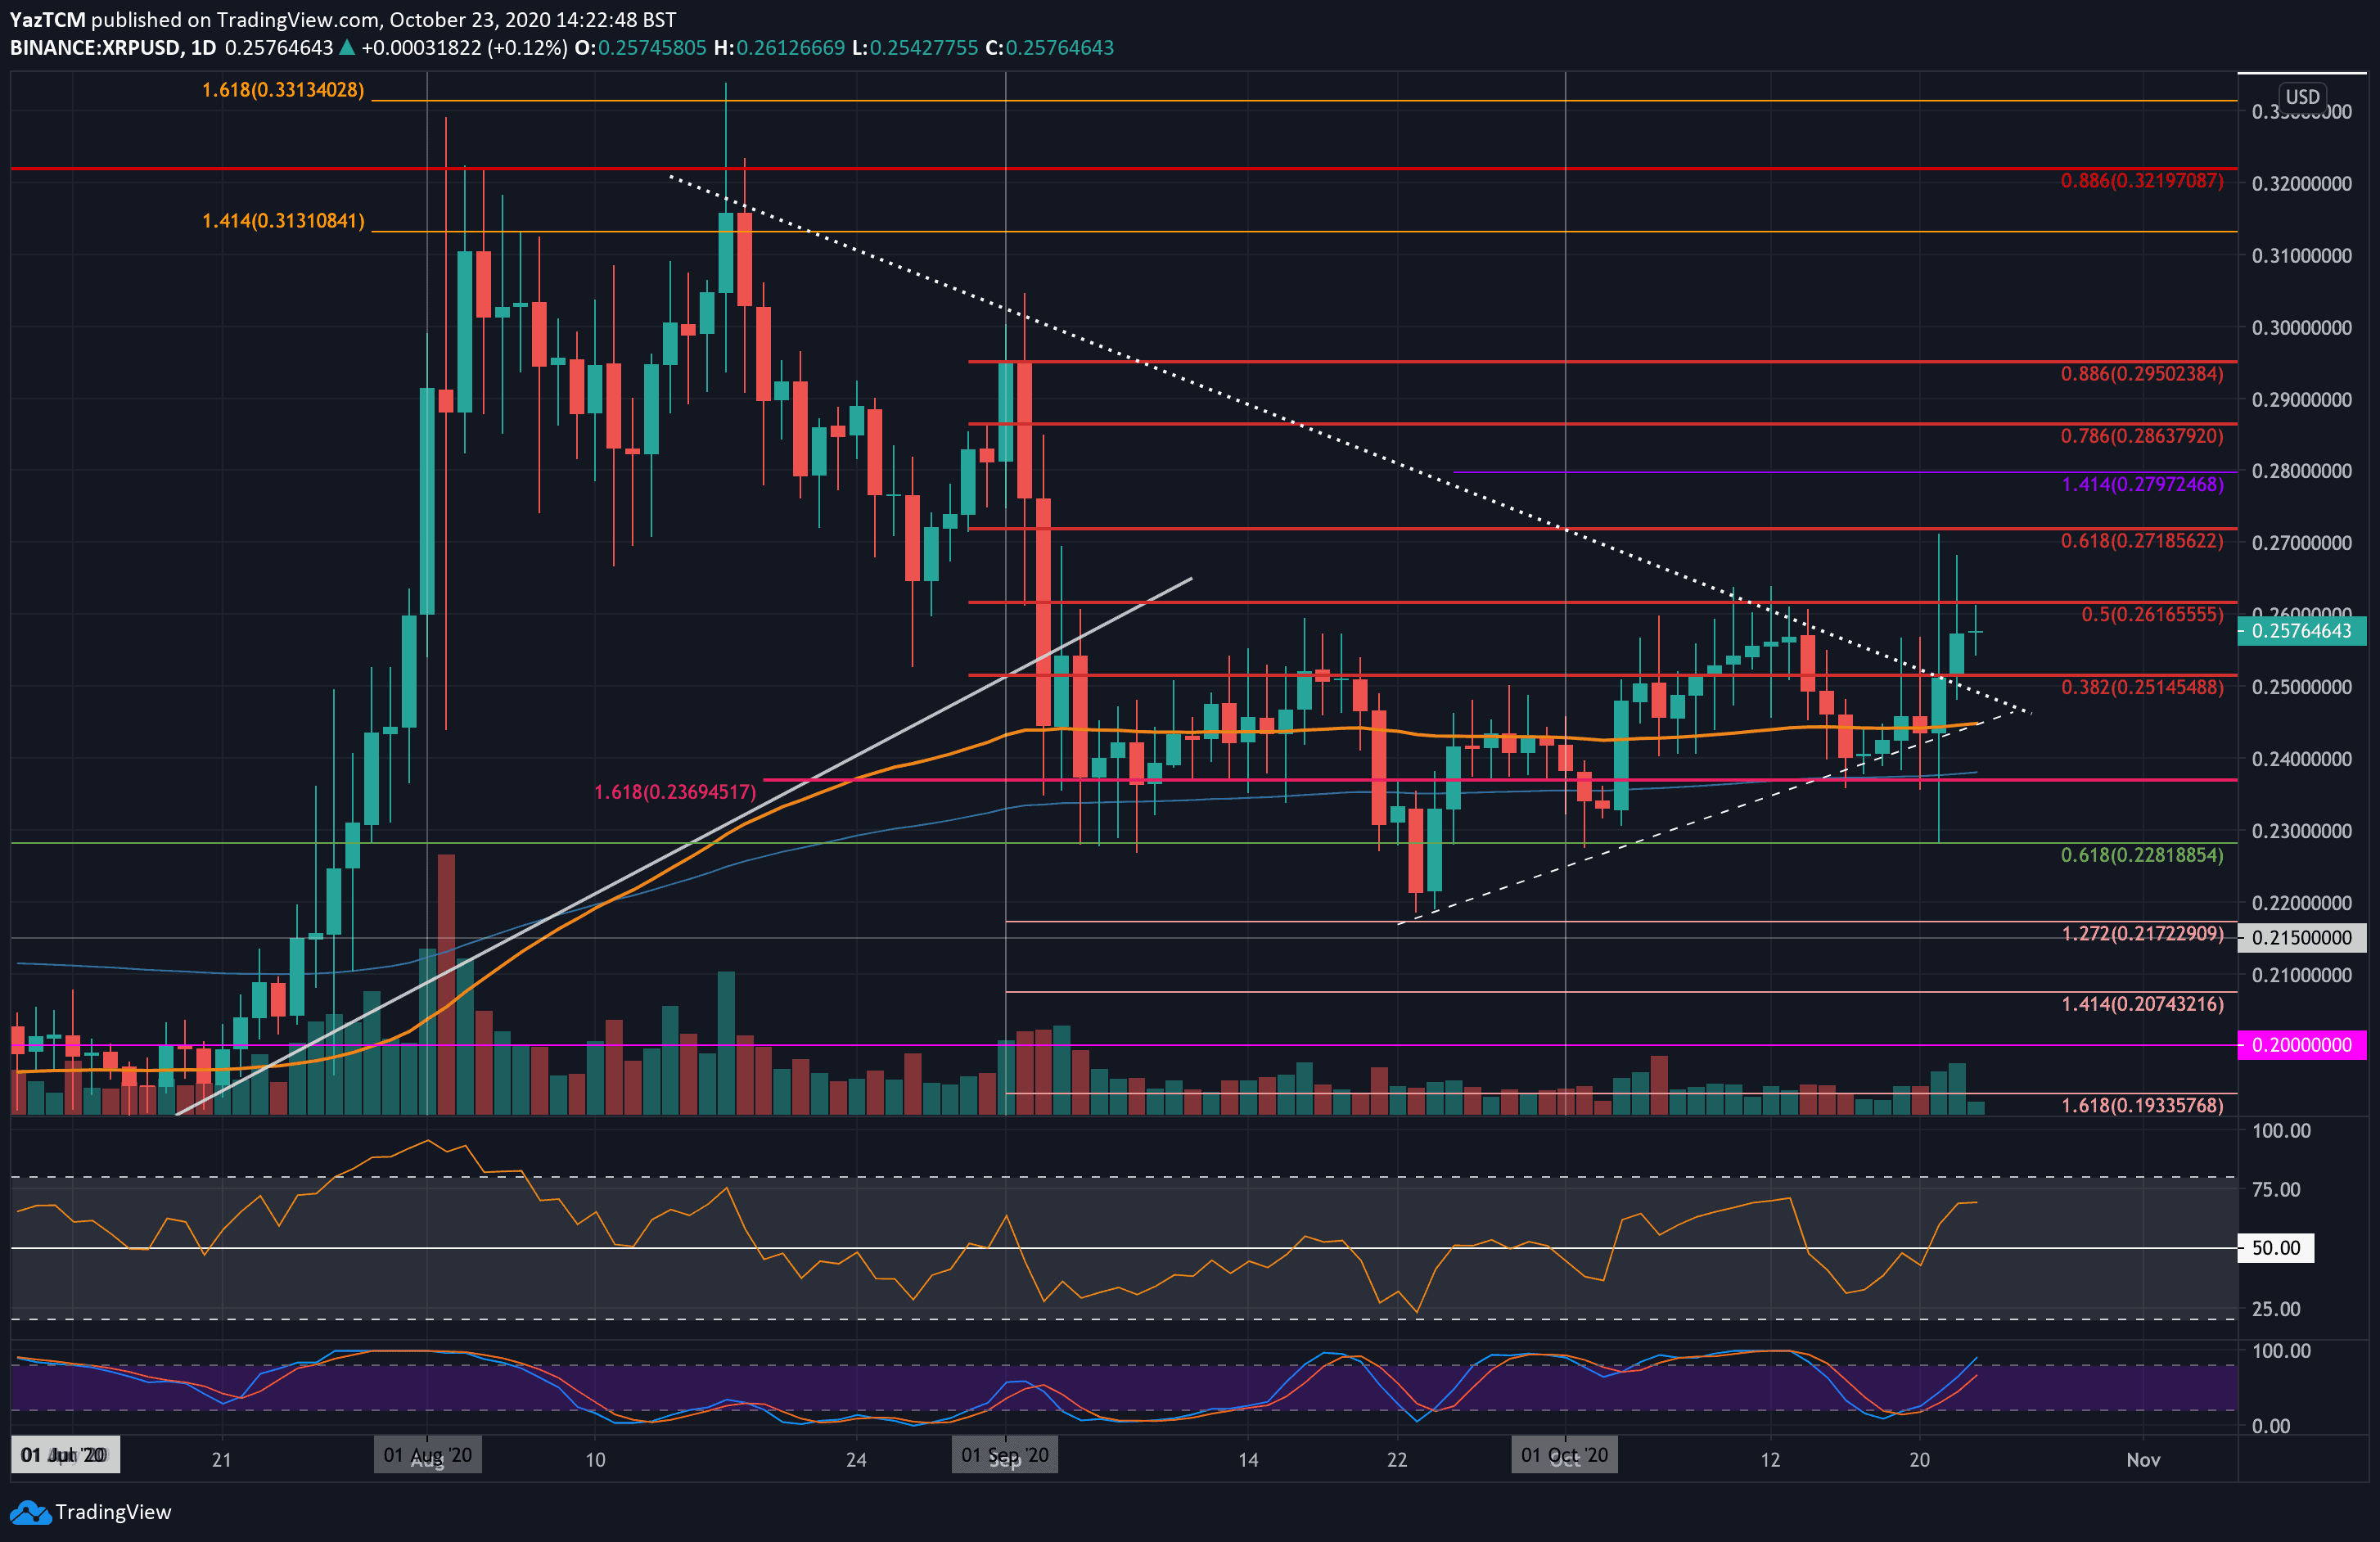
Ripple saw a smaller 4.7% price increase this week as it trades at $0.0257. The coin managed to break above a symmetrical triangle pattern during the week but failed to close a daily candle above the $0.261 resistance (bearish .5 Fib Retracement). The buyers must close above this resistance for XRP to start a short term bullish trend.
Moving forward, if the bulls manage to close above $0.261, higher resistance lies at $0.271 (bearish .618 Fib), $0.28, $0.286 (bearish .786 Fib), and $0.295 (bearish .886 Fib).
On the other side, support is first expected at $0.25. This is followed by support at $0.245 (200-days EMA), $0.24, and $0.237 (200-days EMA).
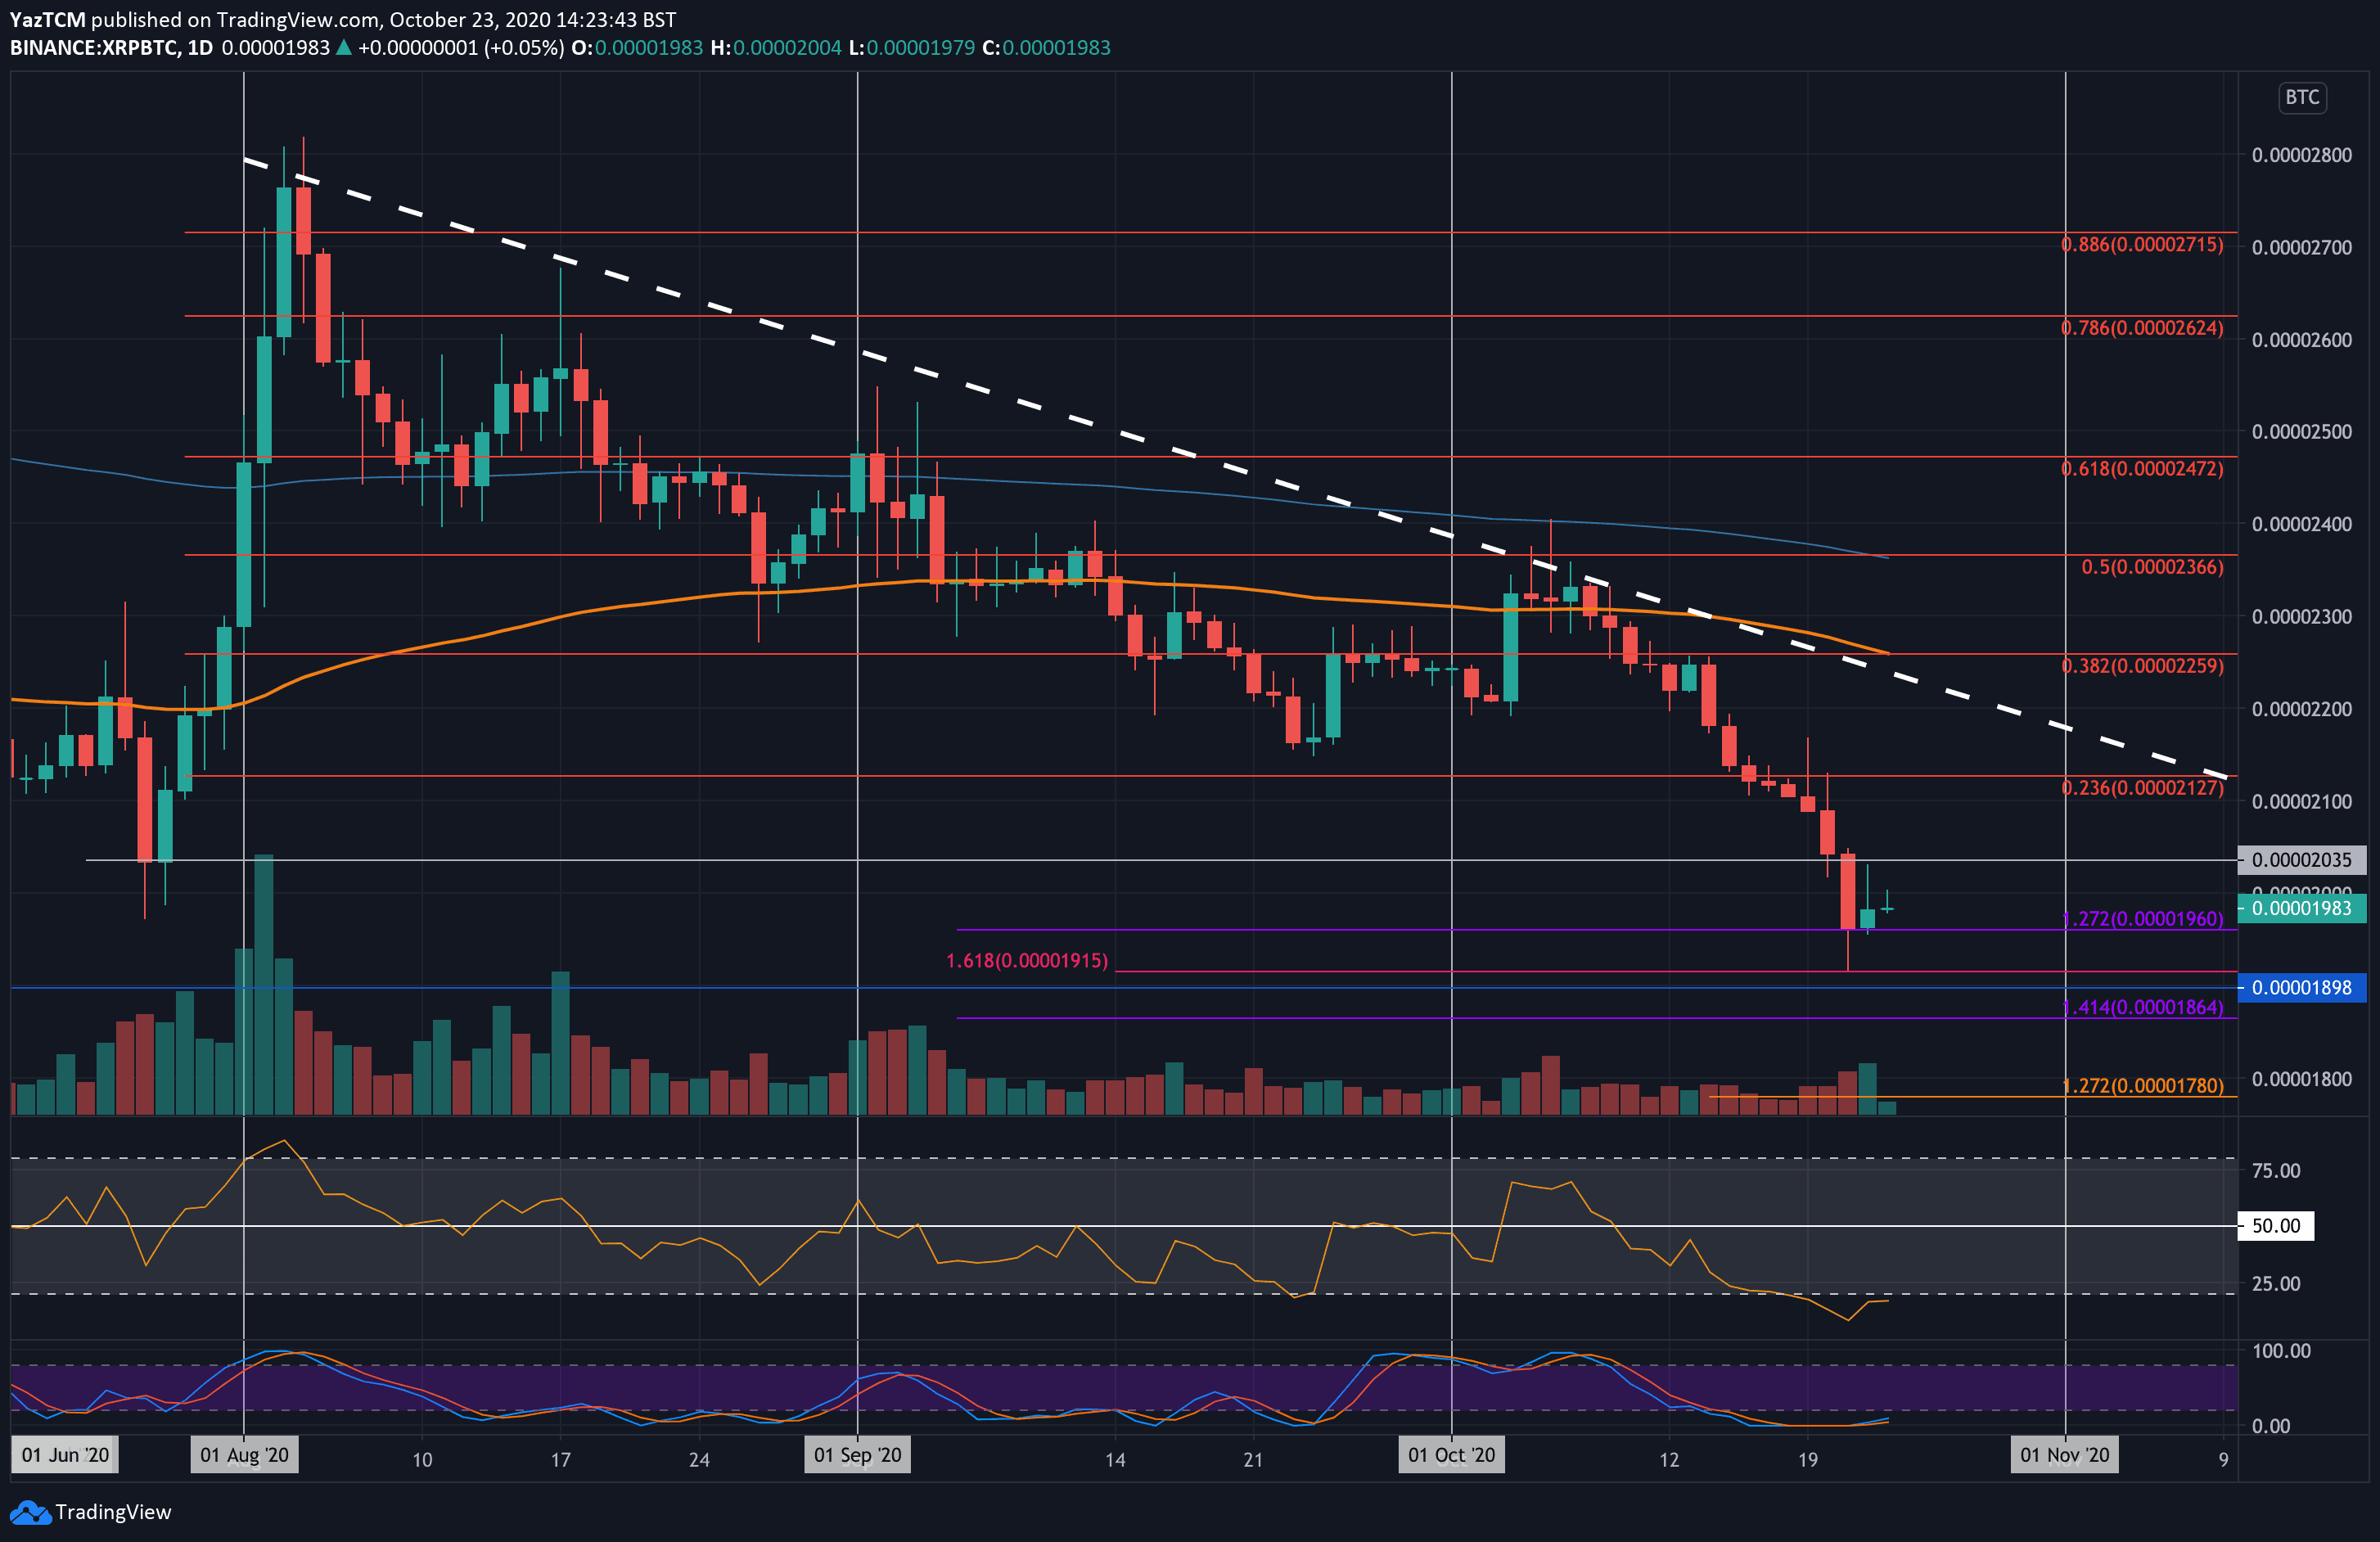
The situation is quite dire for XRP against Bitcoin. The coin dropped from above 2100 SAT at the start of the week as it headed lower to break beneath 2000 SAT and spike as low as 1915 SAT.
The bulls managed to defend the support at 1960 SAT, where the daily candle closed and allowed it to rebound to the current 1983 SAT level.
Looking ahead, if the bulls climb above 2000 SAT, resistance lies at 2035 SAT, 2130 SAT, 2200 SAT, and 2260 SAT.
On the other side, support lies at 1960 SAT, 1915 SAT, 1865 SAT, and 1800 SAT.
Bitcoin Cash
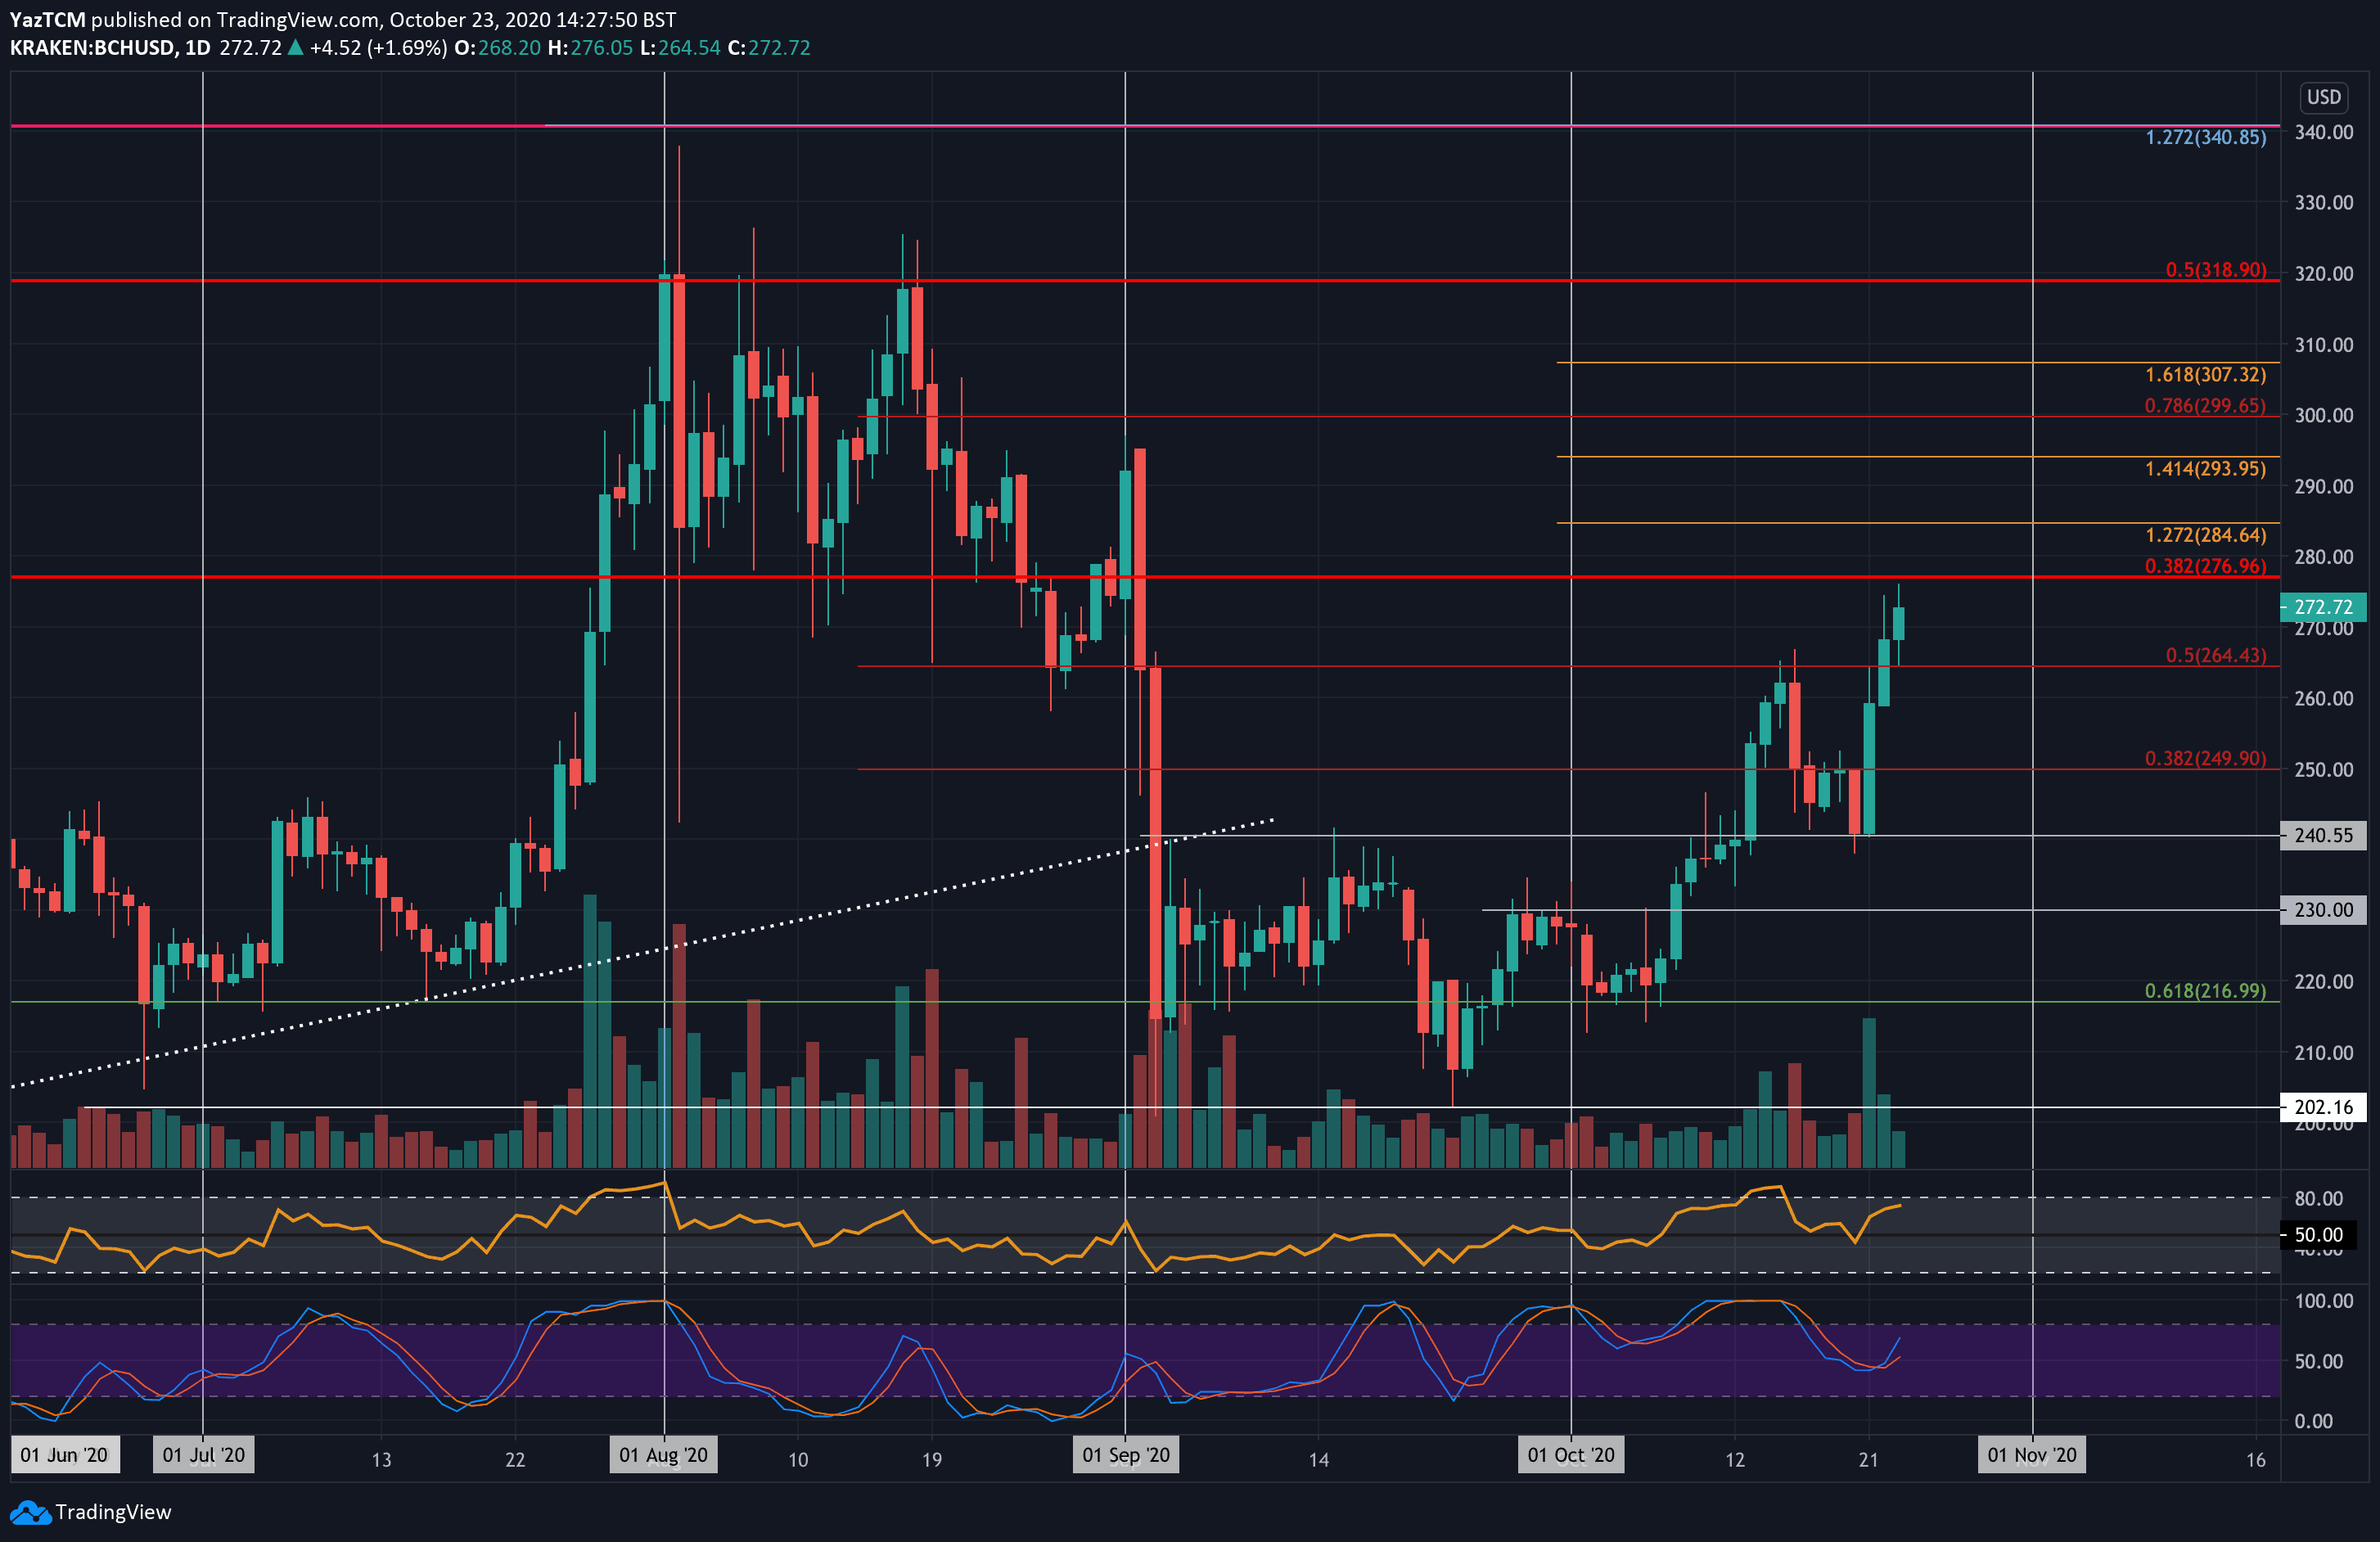
Bitcoin Cash saw a 4% price hike this week as it reached the $278 (bearish .382 Fib) resistance today. The coin pushed higher from $240 during the week which allowed it to create a fresh October high at $278 today.
Looking ahead, if the buyers continued above $278, resistance lies at $285 (1.272 Fib Extension), $294 (1.414 Fib Extension), $300, and $307.
On the other side, support is first expected at $270. Beneath this, support lies at $265, $260, $250, and $240.
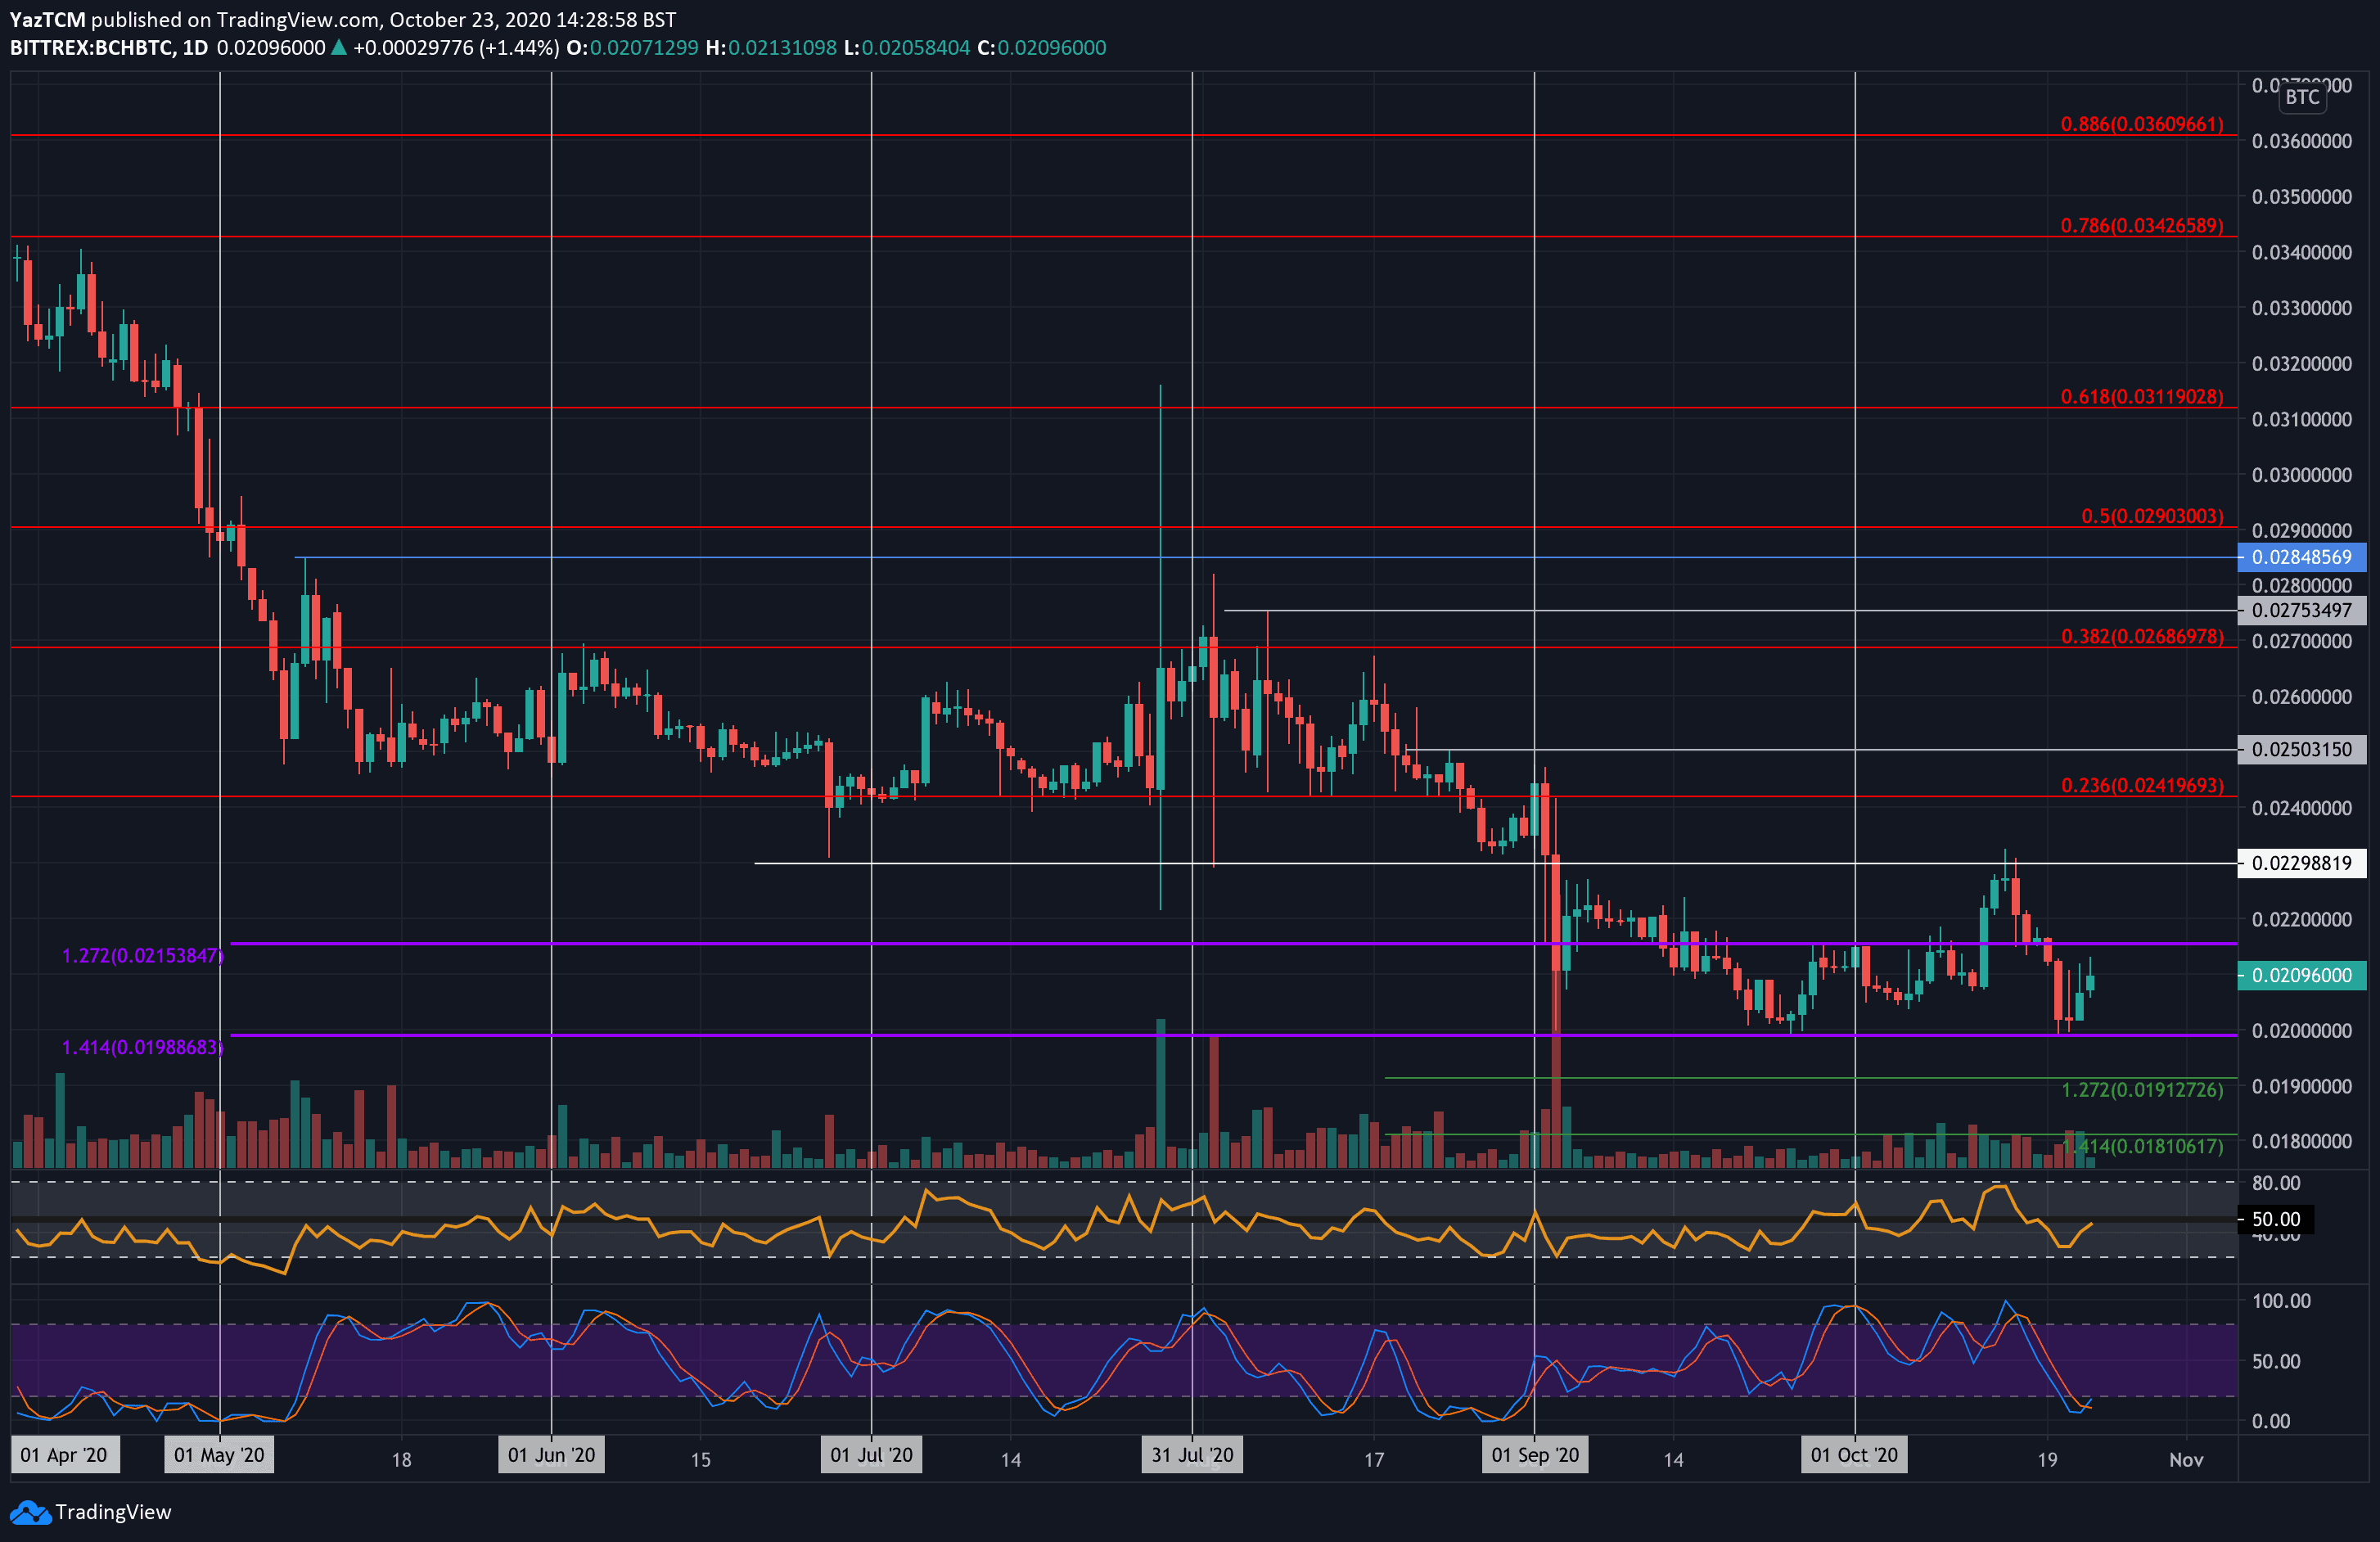
Against Bitcoin, BCH dropped from 0.022 BTC to reach the September support at 0.02 BTC during the week. From there, it rebounded higher to trade at the current 0.021 BTC level.
Moving forward, if the buyers push beyond 0.021 BTC, resistance lies at 0.022 BTC and 0.023 BTC. Additional resistance is then expected at 0.0241 BTC (bearish .236 Fib), 0.025 BTC, and 0.026 BTC.
On the other side, the first level of support lies at 0.02 BTC. Beneath this, support is located at 0.0191 BTC (downside 1.272 Fib), 0.019 BTC, and 0.0181 BTC.
Litecoin
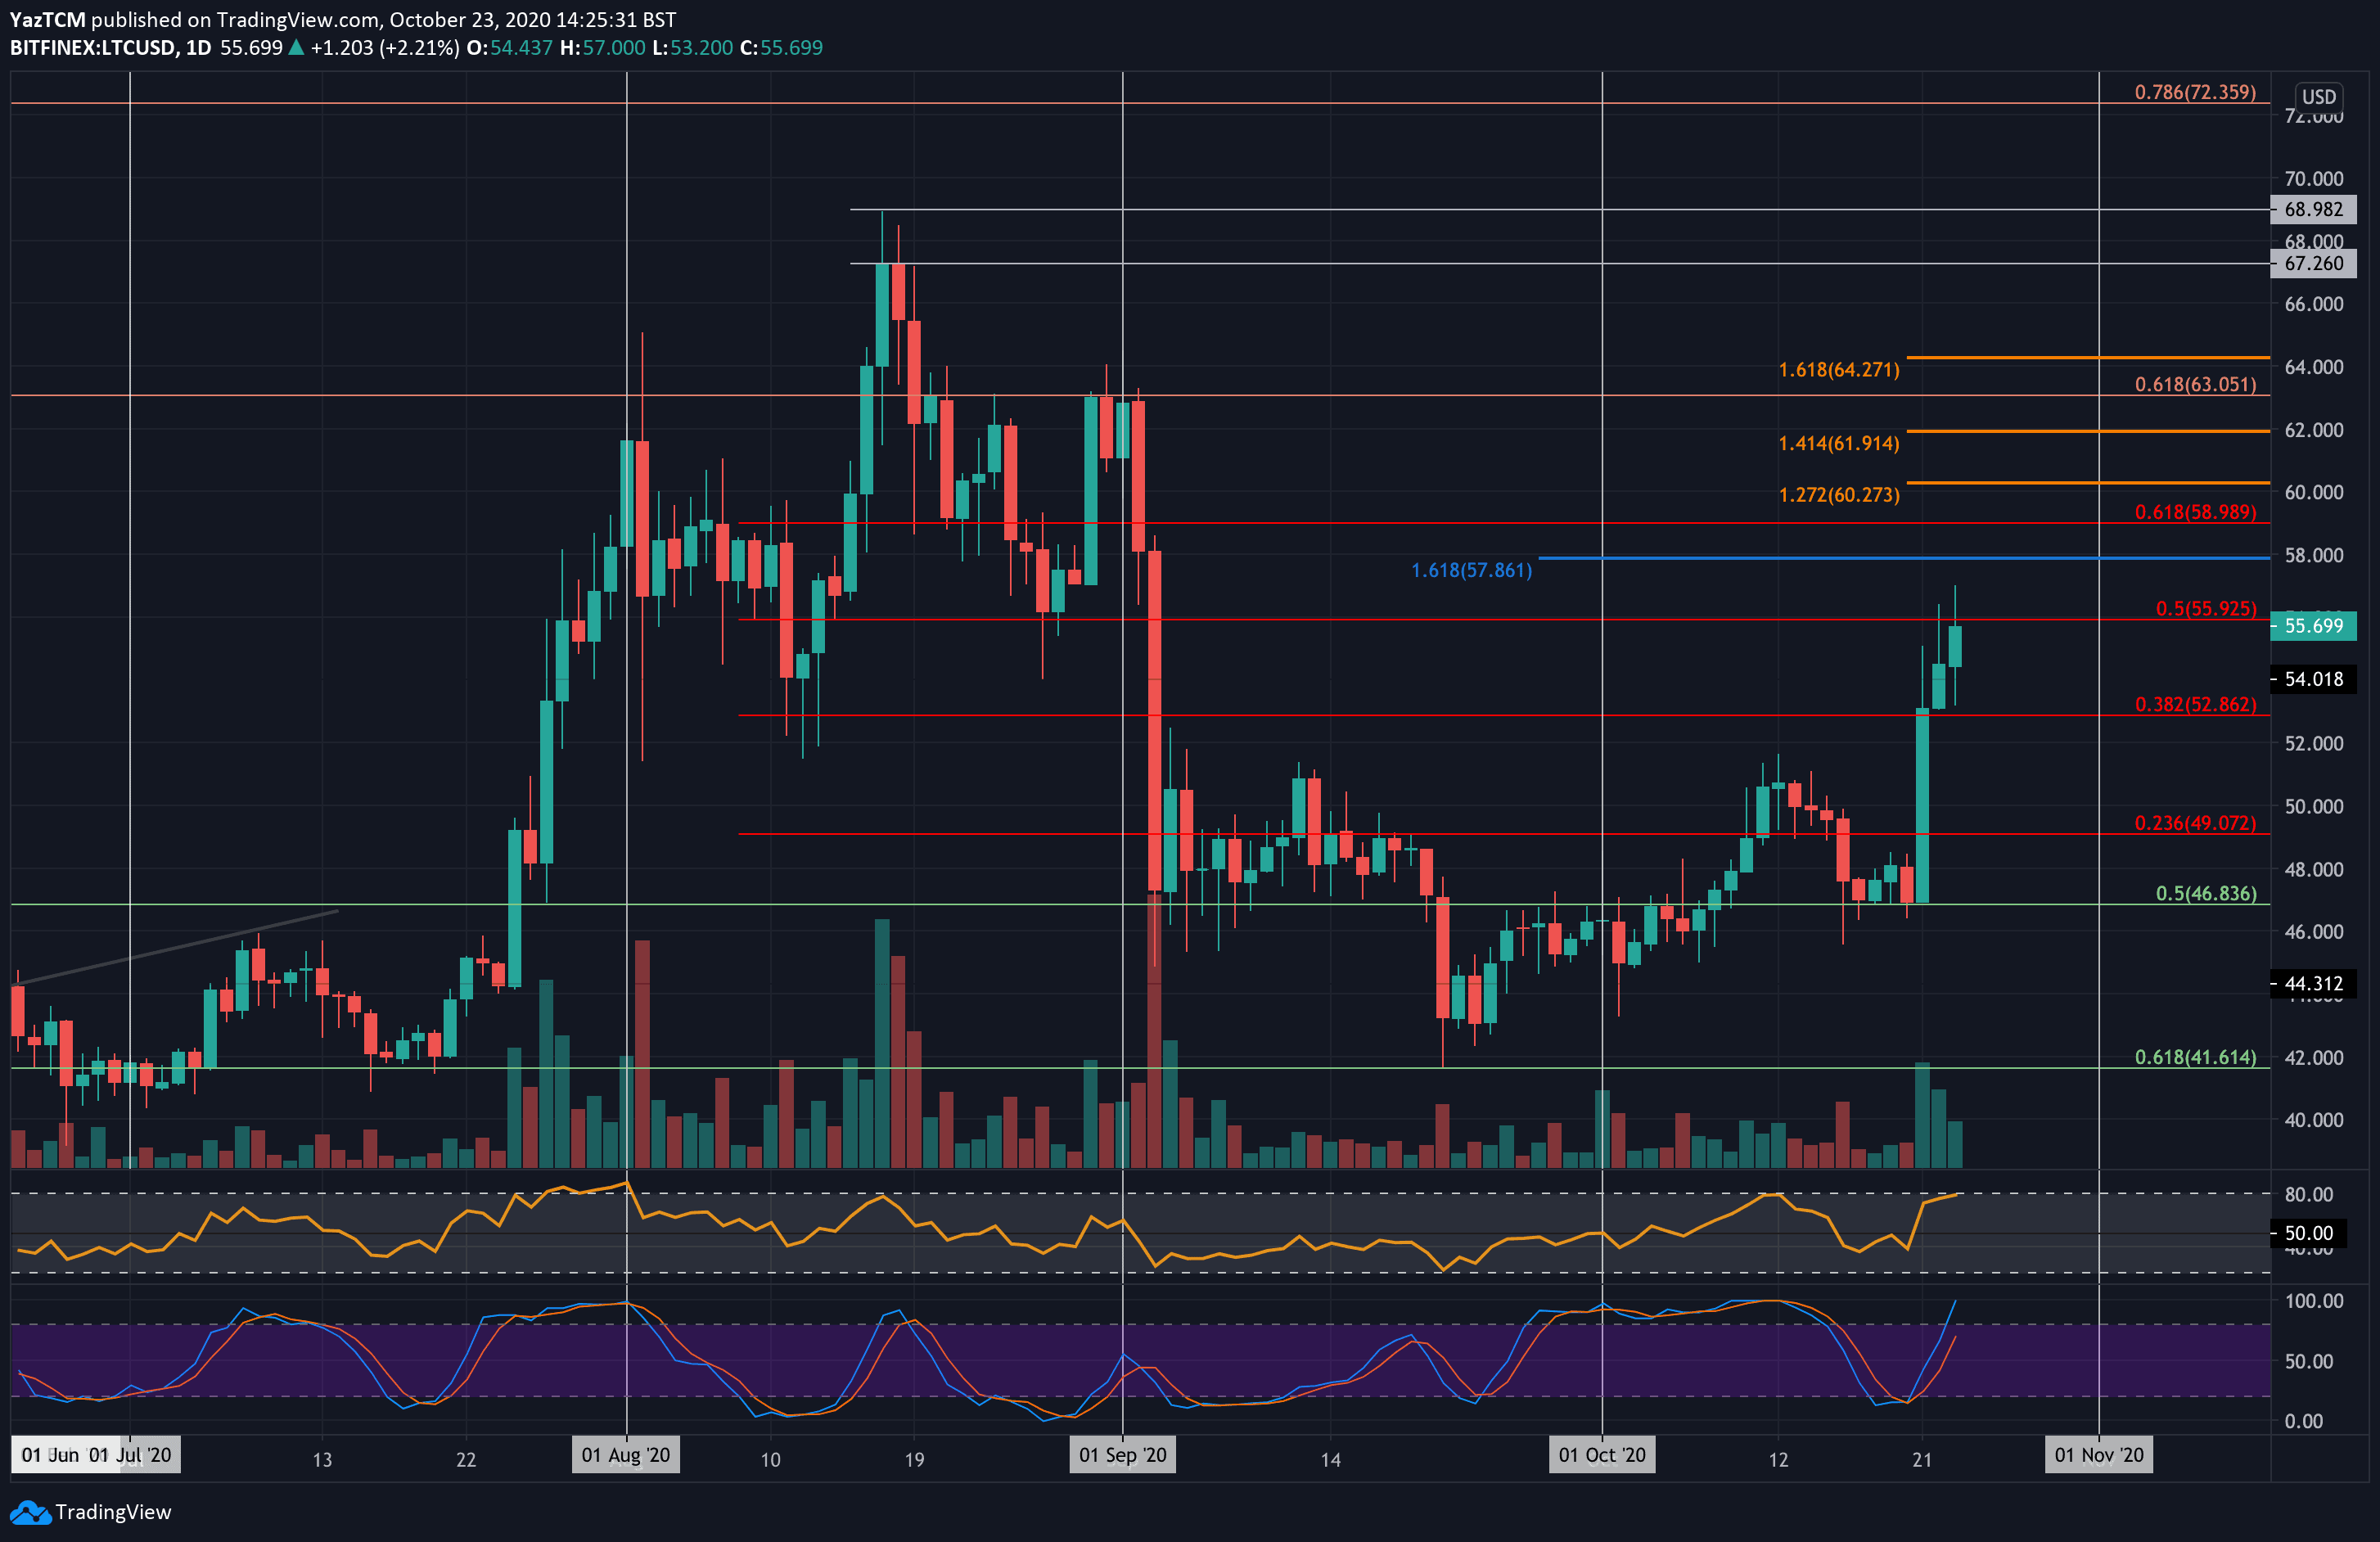
Litecoin saw a serious 12% price increase over the past week as it reached the resistance at $56 today – provided by a bearish .5 Fib Retracement. The coin had found support last week at the $46.83 level and rebounded from here on Wednesday to reach the current resistance.
If the buyers manage to break the resistance at $56 (bearish .5 Fib), higher resistance is located at $57.86, $59 (bearish .618 Fib), $60.27 (1.272 Fib Extension), $61.91 (1.414 Fib Extension), and $63.
On the other side, the first level of support lies at $55. Beneath this, added support is found at $54, $52, $50, and $49.
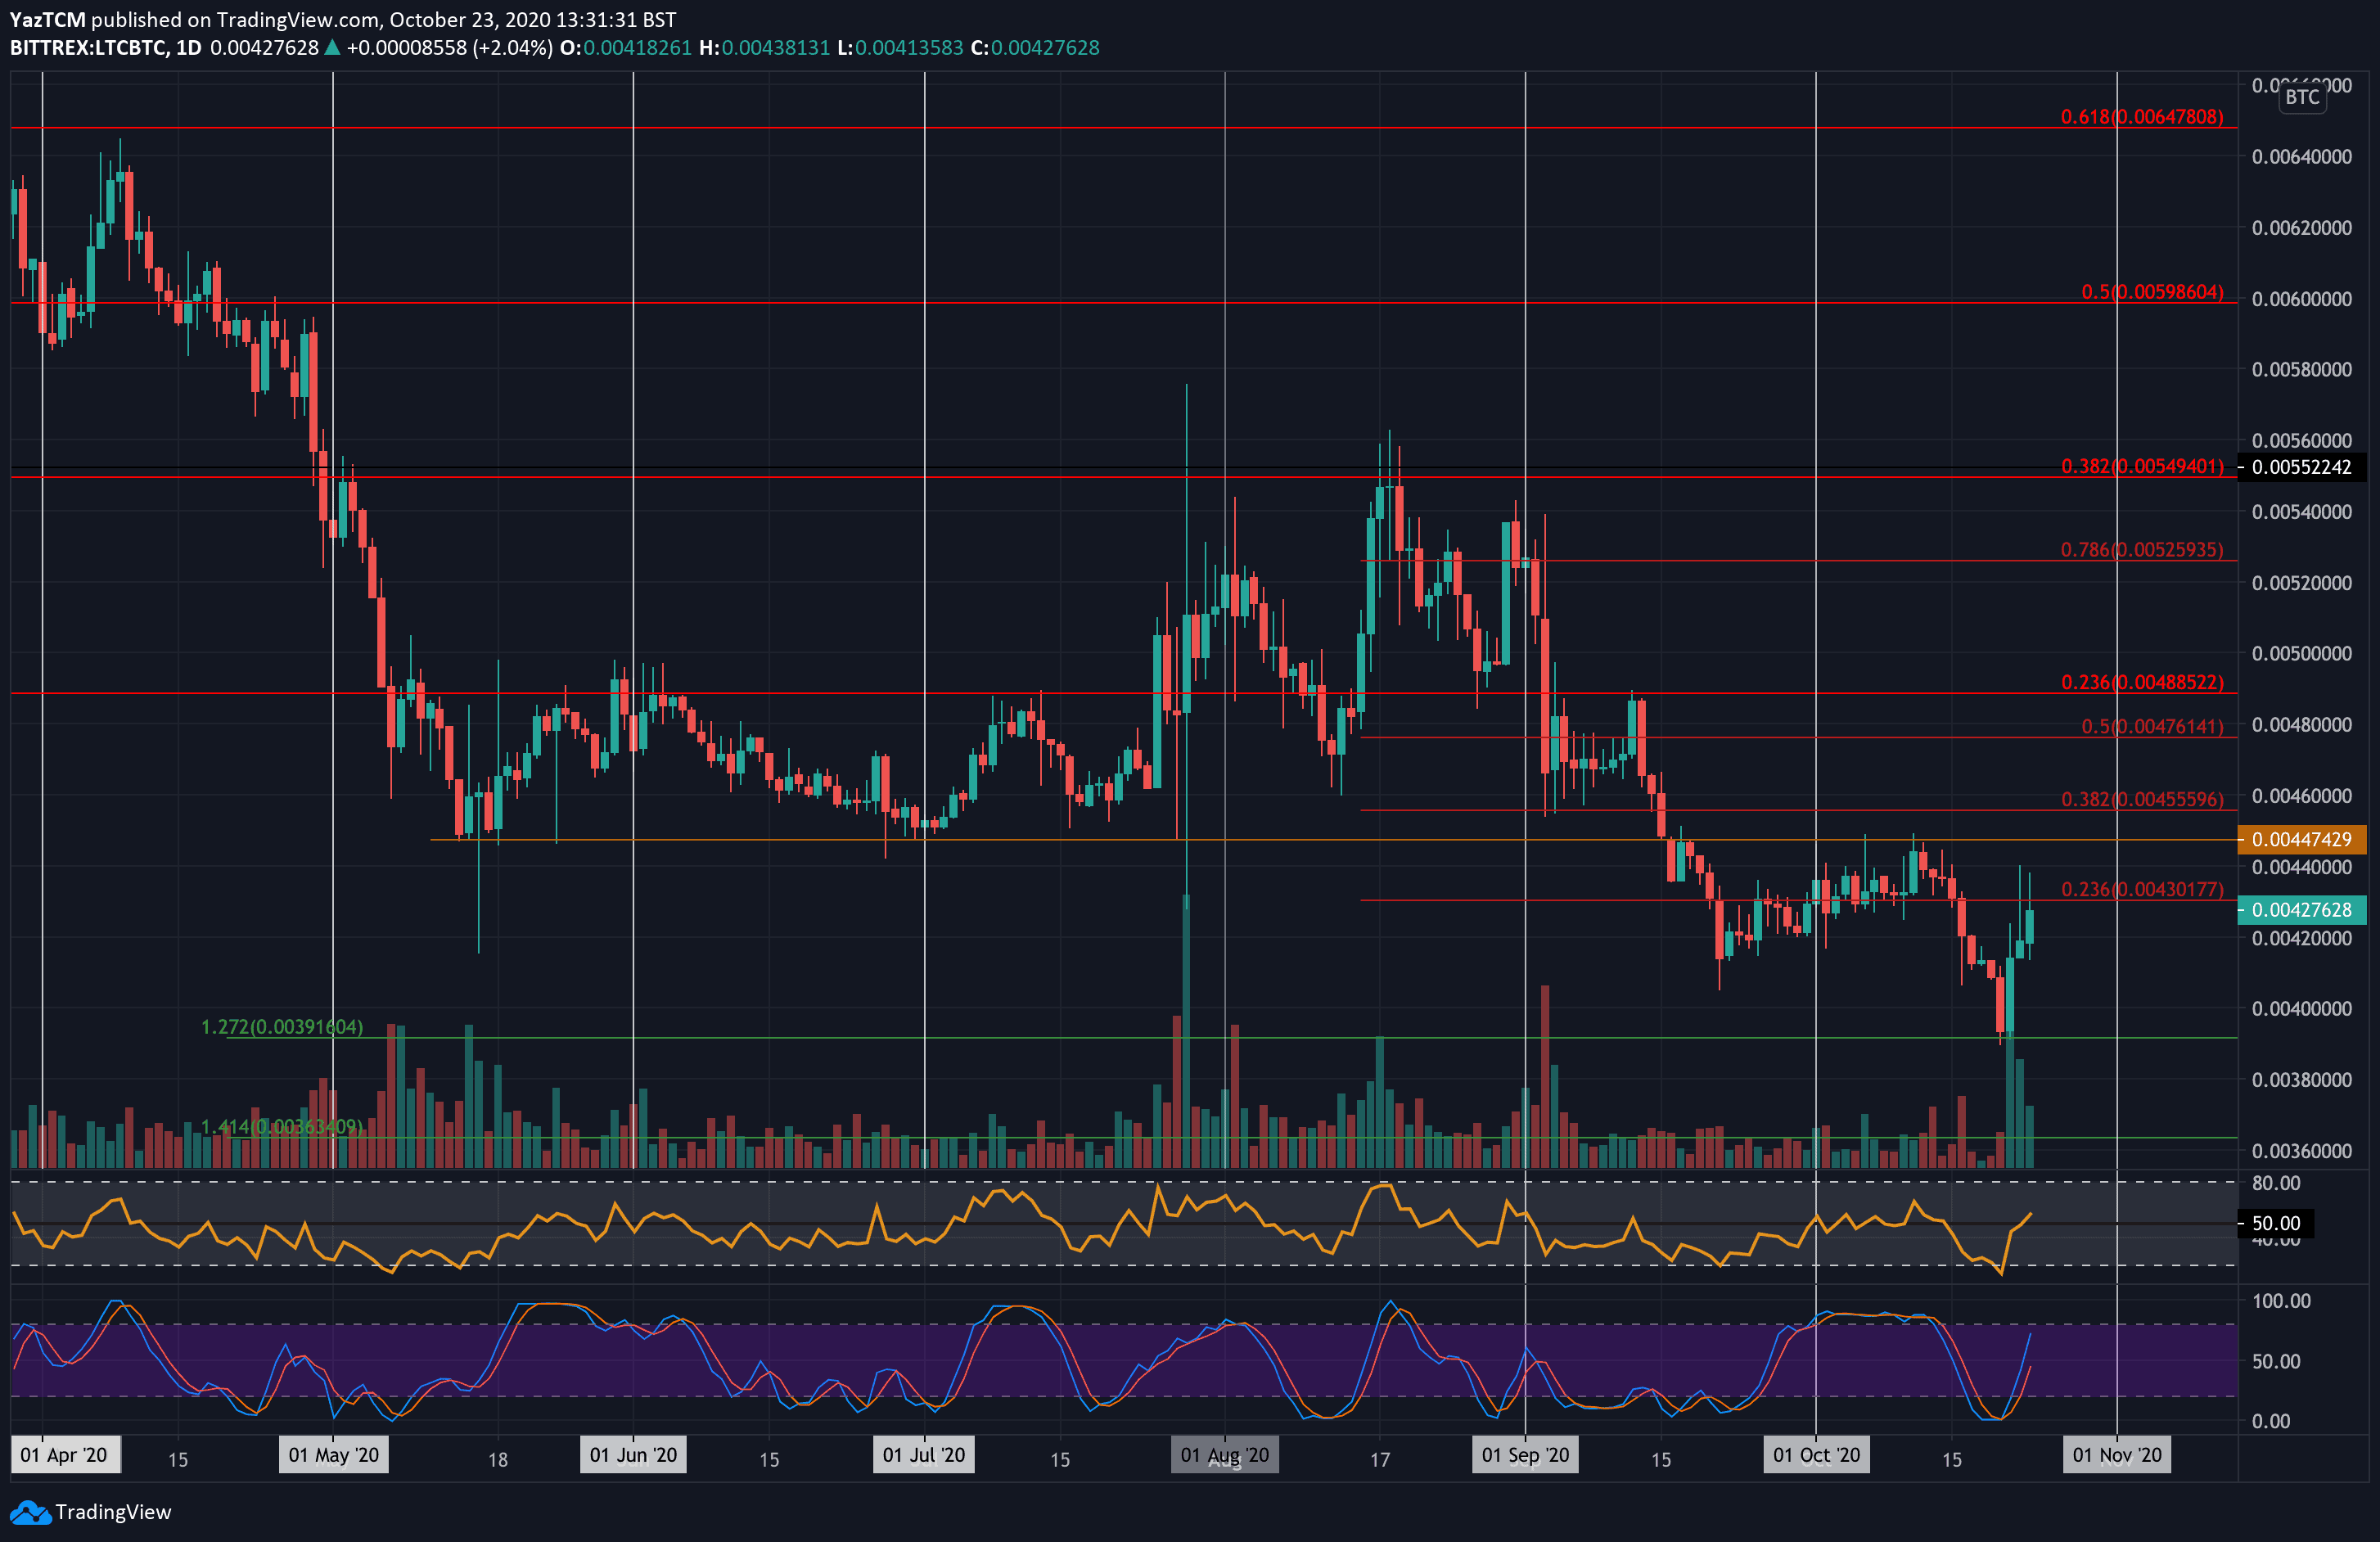
Against Bitcoin, Litecoin dropped to a fresh 2020 price low this week as it hit the support at 0.00391 BTC. From there, the bulls fashioned a rebound higher to reach the current resistance at 0.0043 BTC (bearish .236 Fib Retracement).
Looking ahead, if the buyers can break 0.00343 BTC, resistance first lies at 0.004547 BTC (October Highs). This is followed by resistance at 0.00455 BTC, 0.00476 BTC, 0.00488 BTC, and 0.005 BTC.
On the other side, support is first expected at 0.0042 BTC. This is followed by support at 0.0041 BTC, 0.004 BTC, and 0.00391 BTC. Additional support lies at 0.0039 BTC and 0.00363 BTC.
Binance Futures 50 USDT FREE Voucher: Use this link to register & get 10% off fees and 50 USDT when trading 500 USDT (limited offer).
Disclaimer: Information found on CryptoPotato is those of writers quoted. It does not represent the opinions of CryptoPotato on whether to buy, sell, or hold any investments. You are advised to conduct your own research before making any investment decisions. Use provided information at your own risk. See Disclaimer for more information.
Cryptocurrency charts by TradingView.